The markets were busy with lots of economic data on the tap. In the Eurozone, the flash inflation estimates showed that headline consumer prices increased 2.1% on the year ending June. This was above expectations and even the core inflation rate was seen to have increased 1.1% on the year.
On the downside, the preliminary GDP reports for the second quarter suggested that growth in the Eurozone expanded just 0.3%. This was slower than the 0.4% estimates and the rate of expansion from the previous quarter.
Canada's monthly GDP figures showed a strong 0.5% increase on the month. The data beat estimates of a 0.3% increase.
In the U.S. trading session, the core PCE price index data showed a 0.1% increase on the month, matching estimates. Personal spending and income increased 0.4% respectively.
In the overnight trading session, the New Zealand employment data showed that the unemployment rate increased to 4.5% coming in above estimates of 4.4%. The quarterly employment change increased 0.5%.
Investors will be looking to a new trading month. The UK's manufacturing PMI is on the tap this week with forecasts expected to show a modest reading of 54.2.
The U.S. trading session will see the release of the ADP private payrolls followed by the ISM's manufacturing PMI. Manufacturing activity is expected to show a print of 59.2. Later in the afternoon, the FOMC will be releasing its monetary policy statement. No changes are expected at today's meeting.
EUR/USD intra-day analysis

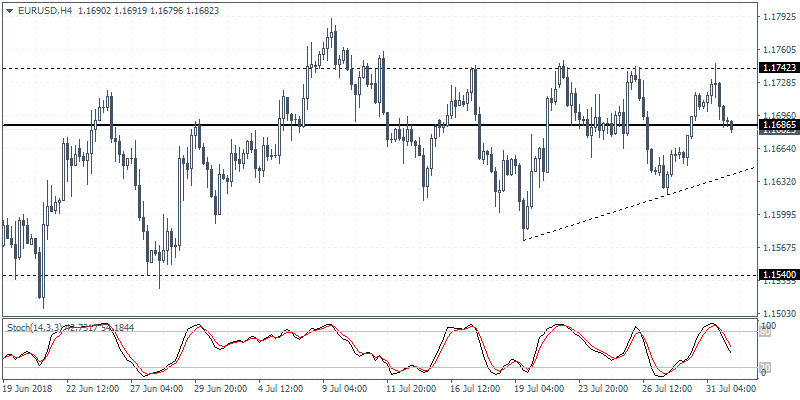
EUR/USD (1.1682): The EUR/USD currency pair once again failed to break past the resistance level as price action gave up the gains near 1.1730. With the consolidation likely to continue, we expect to see some downside momentum building up in the near term. On the 4-hour chart, price action is seen trading back at the short term support near 1.1686 level. There is a possibility that a break down below this level could see price finding dynamic support near the rising trend line. In the event of a break down below this level we expect further declines to push EUR/USD lower to 1.1540.
USD/JPY intra-day analysis

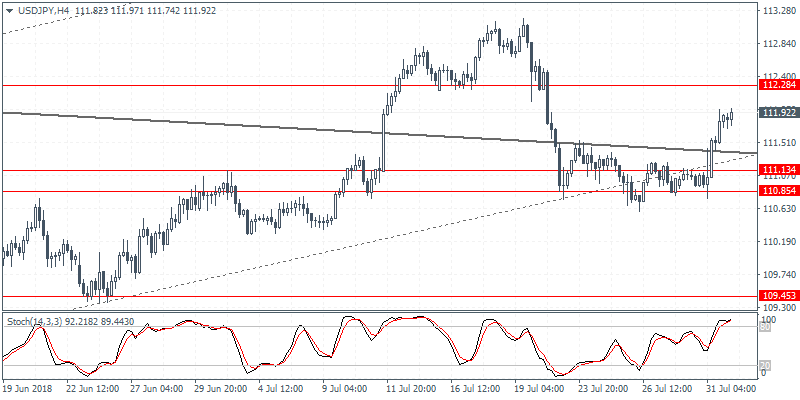
USD/JPY (111.92): The USD/JPY currency pair was seen bouncing off the support level near 111.13 - 110.85 to close higher on the day. As price action approaches the resistance level near 112.28, the currency pair could settle back into the range within the mentioned levels. USD/JPY will need to clear the resistance level of 112.28 in order to confirm the upside with a potential break of the previous highs. To the downside, the declines could be limited to the support level.
XAU/USD intra-day analysis

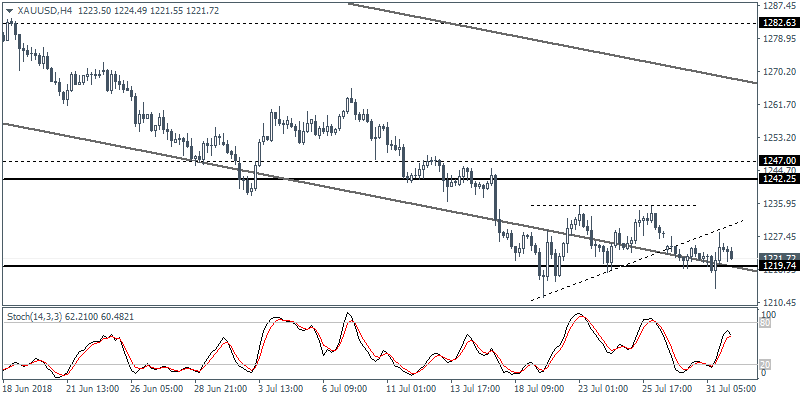
XAU/USD (1221.72): Gold prices formed an outside bar on Tuesday as price action held up near the support level of 1219.75 region. With multiple tests to the support level, gold prices could be potentially forming a bottom in the near term. A rebound off the support near 1219.75 is required to confirm the upside. In the near term, gold prices could maintain the sideways range within 1242.25 resistance and 1219.75 support. A breakout from either of these levels could trigger further gains or losses in the short term.
