Just try and follow the bouncing ball…
What a week in the financial markets! If you didn’t like the 1% move in one direction, you just waited a few hours for it to reverse to the opposite direction. While the markets were bouncing from a deep oversold end of Q3 condition and the bottomless holes of Volkswagen (XETRA:VOWG) and Glencore (LONDON:GLEN) were being plugged, Friday’s weak jobs data was quickly absorbed as good news, rather than bad news. So forget about Fed rate hikes and instead start dreaming about the potential for QE4.
It looks like the equity markets will test the overhead resistant levels this week. Watch for buying volumes to show proof of its strength. Last week we saw several big, broad buying programs, which were likely caused by tactical shifts of pension plans and other systematic investors who were increasing equity weights after a terrible Q3 performance. For increasing signs of health, look for small caps, high yield bonds, financials and emerging markets to outperform. Only the emerging markets showed signs of life last week, while the others took out their 2015 lows.
Time to get your earnings score cards ready. Equities are sharply lower into the earnings period, which means expectations are low. If stocks can rise on earnings misses, then investors will look to trade stocks higher into earnings.
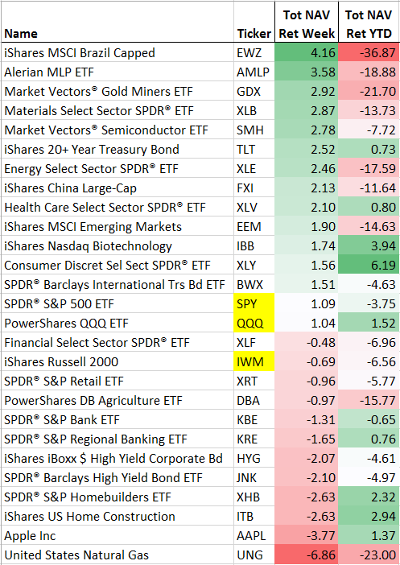
Some interesting moves in the major ETFs this week. YTD bottom performers in the EM, Materials and Commodities areas topped the charts. Meanwhile the better performers YTD ended up at the bottom: Housing, Banks and Apple (NASDAQ:AAPL)…
Q3 was an ugly one for Active Portfolio Managers according to JPMorgan…
J.P. Morgan (NYSE:JPM) notes Q3 was a tough one for active managers. Active manager performance suffered in Q3 with only 33% of mutual funds beating benchmarks during the quarter (vs. 56% in 2Q15). As for YTD, 35% are beating compared to 29% one year ago. Sector positioning explains recent active manager underperformance. In Q3, mutual funds have been favoring Healthcare (NYSE:IXJ) (+2.0% overweight), with their largest single overweight in Pharma/Biotech (+1.1%), while most underweight Staples (NASDAQ:SPLS) (-2.0%). During the quarter, Healthcare significantly underperformed (-11%), while Staples fared much better (-0.9%).
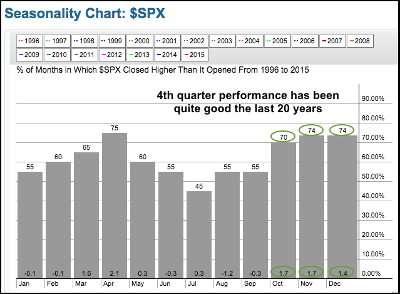
Seasonally, the Q4 should be better for Equity Investors…
(Stockcharts)
But Ryan Detrick notes that fourth quarters following a very bad third quarter have not ended well. Will 2015 be different?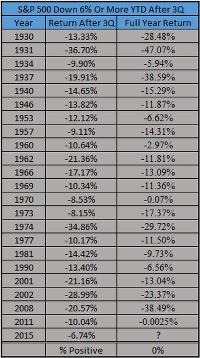
(@RyanDetrick)
So after those weak Jobs numbers on Friday, Mohamed El-Erian thinks it would be a good time for you to double check your 5 point harness and safety bar…
It is becoming increasingly clear that the central bank’s commitment to continue to carry the bulk of the policy burden isn’t sufficient to generate high, inclusive and sustainable growth. Congress needs to step in, too, allowing the government to deploy a broader set of policy responses. Alas, there is little to suggest that such a reaction will be forthcoming. This inertia will hold back corporate enthusiasm for actively deploying large cash holdings into larger productive capabilities and employment. Markets and the global economy are moving closer to an inflection point: Either the growing global economic malaise, accentuated by a structural increase in financial market volatility, will be a wake-up call to policy makers, or the global economy will slip deeper into a self-reinforcing malaise, making it very hard for the central bank to contain financial volatility.
(Bloomberg)
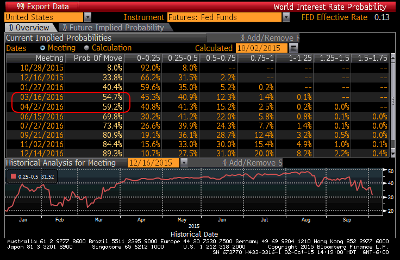
Job weakness pushed the market’s thoughts of a FOMC rate hike out until March/April 2016…
Last week’s ISM Manufacturing data also showed a U.S. slowdown…
Thursday’s ISM Manufacturing report for the month of September showed that conditions in the U.S. Manufacturing sector continue to deteriorate, driven by weakness in the Energy sector and a stronger dollar hurting exports. While economists were expecting the headline reading to come in at a level of 50.6, the actual reading came in at 50.2, just barely hanging on to the 50 level, which is the boundary between growth and contraction. As shown in the chart below, this month’s headline reading was the lowest since May 2013.
(Bespoke)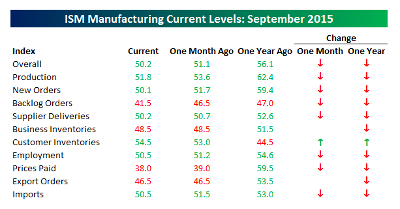
Weak U.S. Manufacturing and Jobs led to a collapse in 2 year Treasury yields…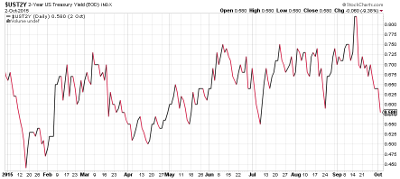
This is going to get ugly. Has anyone seen Michael Lewis in Zug, Baar or N’Djamena this week?
A deal struck last year between Glencore PLC (OTC:GLNCY) and the government of Chad sent $1.4 billion to the African country as an up-front payment for four years of oil shipments. Now, uncertainties over the transaction, which was financed by bank lending, and troubles with other similar deals are shedding light on how Glencore’s energy business has taken some banks into risky areas that are causing jitters as commodity prices fall. At least seven banks signed on to the three-party arrangement with Chad, which was struck when a barrel of crude was trading near $100. Instead of having their primary claim on Glencore, the banks had a claim based on the African country’s oil output and expected to profit from a steady stream of repayments as that oil flowed through Glencore’s global energy and trading business…
Banks in Europe and Africa have invested in billions of dollars’ worth of loans like the Chad transaction, to be repaid by oil deliveries to Glencore from Africa, according to filings and people familiar with the deals. The projected fees for banks were lucrative, with Glencore typically agreeing to pay interest of 6% or 7%, according to people familiar with the terms. It is welcome income to lenders that have curtailed their own trading and ownership of commodities since the financial crisis. Banks often spread the risk of loans by selling pieces to other investors. At the same time, the structures of the arrangements and related derivatives contracts complicate efforts to gauge banks’ overall exposure to commodities and companies such as Glencore, analysts say.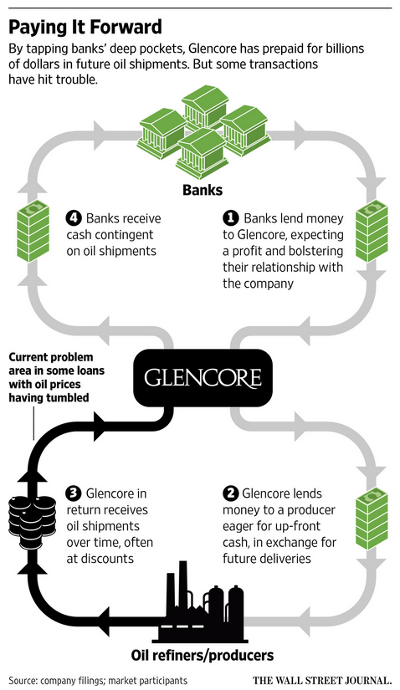
(WSJ)
Glencore may be just a small example of too much borrowing by commodity centric emerging markets?
One of the last havens in emerging markets is showing signs of strain. Companies in emerging markets issued trillions of dollars of foreign-currency bonds during the decade long commodity boom, and took advantage of low interest rates in the developed world following the 2008 financial crisis. Now, many investors fear the commodity bust will lead to a rise in defaults that could deepen economic slumps in many of these nations… Emerging-market corporate debt as a proportion of gross domestic product grew 26 percentage points in the decade through the end of 2014, to 74% with the largest increases in China, Turkey, Chile, Brazil, India and Peru, the IMF said… Credit quality among emerging-market issuers is deteriorating, according J.P. Morgan, which expects the default rate among emerging-market high-yield corporate issuers to reach 5.4% this year, up from 3.2% in 2014. The global default rate is expected to reach 2.7% by the end of this year, according to Moody’s Investors Service.
(WSJ)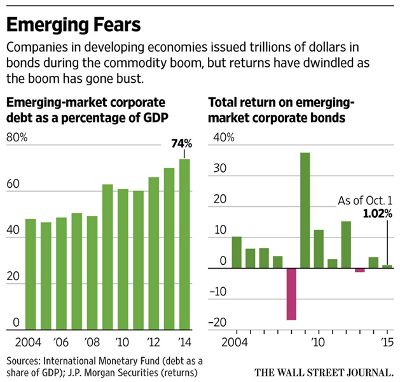
The increase in risky borrowing is not just a commodity and emerging market problem…
For the first time since the financial crisis, total returns from speculative grade US debt — generally riskier bonds issued by companies rated BB+ or lower by Standard & Poor’s or Ba1 by Moody’s — are set to decline. The Barclays (LONDON:BARC) US high yield index is down 2.3 per cent for 2015. As borrowing costs rise and defaults have accelerated, investors have withdrawn more than $14bn from junk bond funds since the middle of April. The yield on the BofA Merrill Lynch high yield index has climbed to 7.98 per cent from 6.52 per cent a year ago. “We are in the late stages of the credit cycle,” said Edwin Tai, a distressed debt portfolio manager at Newfleet Asset Management. “Cycles last five to seven years and we’re in the seventh year. It’s when the US economy slows that you have defaults across the board.” Already in 2015, more US companies have defaulted than at any time since 2009, according to S&P. The list of 47 filings includes RadioShack (OTC:RSHCQ), Patriot Coal and Quiksilver (NYSE:ZQK), the surfwear retailer.
(FinancialTimes)
Okay, time for some fun with charts. I will pick on Morgan Stanley (NYSE:MS) because it gets U.S. stock sentiment exposure to the capital markets and asset management. But you can substitute Goldman Sachs (NYSE:GS), Berkshire Hathaway (NYSE:BRKa) or your favorite Financial Services ETF into the analysis and get similar results. Take a look at this 3 year weekly chart…
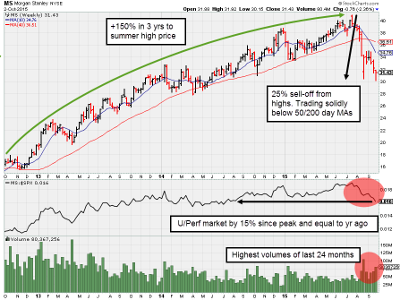
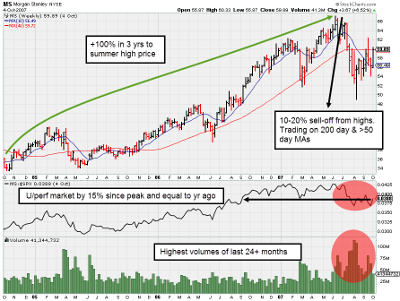
…and compare it to this weekly chart from 8 years ago. Then let me remind you that the better looking Morgan Stanley (or substitute your favorite financial stock or ETF) below went on to lose most of its value. (Morgan Stanley traded below $10/share.) Could financial stocks fall 80% from today’s levels? Of course they could. I don’t think they will because the banking system should be in better shape than the Mortgage Industry fueled party that led to the Big Short. But when you start thinking about how much money has been borrowed and committed on commodity prices at much higher levels like in the above WSJ article, and who knows how many banks and investors will face extreme losses? It is time to keep your antennae up and stay on top of the spreads in the credit markets. Equities will have a difficult time putting in a sustainable recovery without a global improvement in credit.
One expert on top of credit trends is Jeffrey Gundlach. And from where he stands, he sees risk asset prices going lower…
“The market bottoms out when people are selling and sold out – not when they are holding and hoping. I don’t think you’ve seen real selling in risk assets broadly. Markets need buying to go up and they need volume to go up. They can fall just on gravity.”…
Gundlach said junk bonds are vulnerable:
“I’ll think about buying when it stops going down every single day.”
“People are acting like everything is great. Junk bonds are at a four-year low. Emerging markets are at a six-year low and commodities are at a multi-year low – same level as in 1995 … GDP is not growing at a nominal basis.”
“Clearly what’s happening is people are waking up to the idea that global growth is not what they thought it was.”
He added:
“There’s going to be another wave down in risk assets and it’s happening globally.”
(Reuters)
One measure of credit risk fell to 3-year lows last week…
@Eurofaultlines: NYSE:HYG-to-NYSE:LQD ratio has plunged below the August low and now trades near a three-year low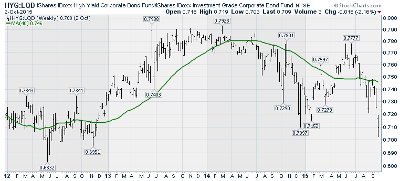
And so did pure High Yield credit spreads…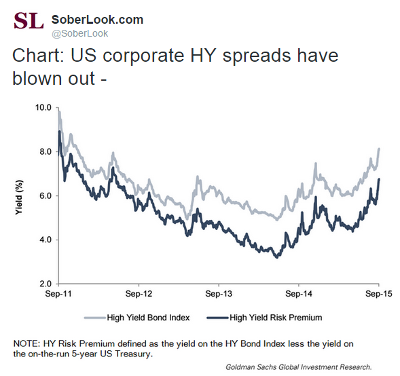
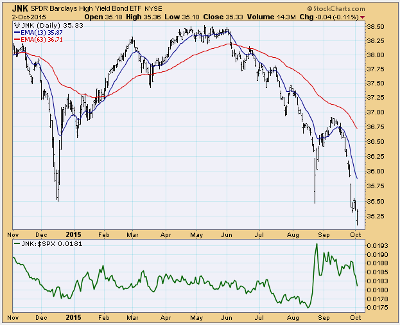
As did the raw Junk Bond (NYSE:JNK) ETF price. Barron’s recommended high yield bonds over the weekend, so the bounce this week should be very telling about the market…
One of the more interesting health care industry developments got some more press this weekend…
Valeant’s habit of buying up existing drugs and raising prices aggressively, rather than trying to develop new drugs, has also drawn the ire of lawmakers and helped stoke public outrage against the growing trend of higher and higher drug prices imposed by big drug companies. This year alone, Valeant raised prices on its brand-name drugs an average of 66 percent, according to a Deutsche Bank (XETRA:DBKGn) analysis, about five times as much as its closest industry peers.
(NYTimes)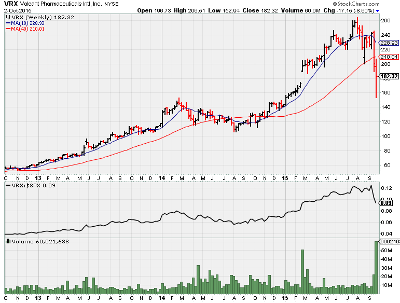
Not just stock prices are being hit by the drug inflation news…
Investors and funds are experiencing a stinging sensation after piling into junk bonds issued by a number of healthcare companies that are now attracting scrutiny over their high levels of debt and aggressive drugs pricing. Prices of bonds issued by a number of the companies that have been accused of overpricing — including Valeant Pharmaceuticals (NYSE:VRX), Endo International (NASDAQ:ENDP) and Mallinckrodt (NYSE:MNK) — have fallen sharply, pushing up yields, in the wake of criticism over the cost of medicines… Last month, prices of junk pharmaceutical bonds dropped 4.33 per cent, offsetting the 0.48 per cent return from coupons on the debt, according to Barclays Indices. By contrast, the overall high-yield corporate market slid 2.75 per cent. The pressure on pharma bond prices comes as companies have been criticized for the way they price their drugs. The price charged by Endo for a bottle of 50 100mg tablets of doxycycline hyclate, used to treat bacterial infections, increased by almost 5,000 percent from $4 to $191 between October 2013 and April 2014.
(FinancialTimes)
If driverless cars could cut fatalities by 90%, why isn’t the shift a higher priority for everyone?
Researchers estimate that driverless cars could, by midcentury, reduce traffic fatalities by up to 90 percent. Which means that, using the number of fatalities in 2013 as a baseline, self-driving cars could save 29,447 lives a year. In the United States alone; that’s nearly 300,000 fatalities prevented over the course of a decade, and 1.5 million lives saved in a half-century… Globally, there are about 1.2 million traffic fatalities annually, according to the World Health Organization. Which means driverless cars are poised to save 10 million lives per decade—and 50 million lives around the world in half a century.
“By midcentury, the penetration of [autonomous vehicles] and other [advanced driver-assistance systems] could ultimately cause vehicle crashes in the United States to fall from second to ninth place in terms of their lethality ranking among accident types,”
wrote Michele Bertoncello and Dominik Wee in a paper for the consulting firm, McKinsey & Company. Bertoncello and Wee further estimate that better road safety will save as much as $190 billion a year in health-care costs associated with accidents.
(TheAtlantic)
Quote of the Week…
“I’m late to realizing that it’s you guys, it’s the private sector, it’s commerce that’s going to take the majority of people out of extreme poverty and, as an activist, I almost found that hard to say”
(Bono at the U.N. Private Sector Forum in NYC)
Finally, there is no better advertising for STEM studies than ‘The Martian.’ I took my 11 and 15 year olds, plus 1/3 of the high school physics class. It was the best $200 that I have ever spent on a group of kids. Like the book, there is no violence or bad guys. Just a small handful of bad words that your kids heard watching BPL or NFL football this weekend. So if you haven’t already, grab a kid and give him an extra reason to open the math, science and computer science homework…
Millions of earthlings sought out “The Martian” this weekend, easily rocketing the film to the top of the box office. The film, starring Matt Damon as an astronaut stranded on Mars, made its debut with an estimated $55 million in the U.S. and Canada. It has enjoyed tremendous critical support and a massive marketing campaign that has put Mr. Damon front-and-center in recent weeks.
(WSJ)
The information presented here is for informational purposes only, and this document is not to be construed as an offer to sell, or the solicitation of an offer to buy, securities. Some investments are not suitable for all investors, and there can be no assurance that any investment strategy will be successful. The hyperlinks included in this message provide direct access to other Internet resources, including Web sites. While we believe this information to be from reliable sources, 361 Capital is not responsible for the accuracy or content of information contained in these sites. Although we make every effort to ensure these links are accurate, up to date and relevant, we cannot take responsibility for pages maintained by external providers. The views expressed by these external providers on their own Web pages or on external sites they link to are not necessarily those of 361 Capital.
