
Fluor Corporation (NYSE:FLR) reported a net loss of 13 cents per share in first-quarter 2018 comparing unfavorably with net earnings of 43 cents per share in the year ago period. The bottom-line plunge can primarily be attributed to after-tax charge for forecast revisions on a gas-fired power project.
Excluding the charges, the company’s earnings came in at 56 cents, which missed the Zacks Consensus Estimate of 81 cents by 30.9%.
Inside the Headlines
First-quarter revenues came in at $4,823.8 million, lagging the Zacks Consensus Estimate of $4,838 million and were relatively flat year over year. Decline in revenues from Mining, Industrial, Infrastructure & Power and Energy & Chemicals more than offset the revenue gain at the Government and Diversified Services segments.
Fluor Corporation Price, Consensus and EPS Surprise
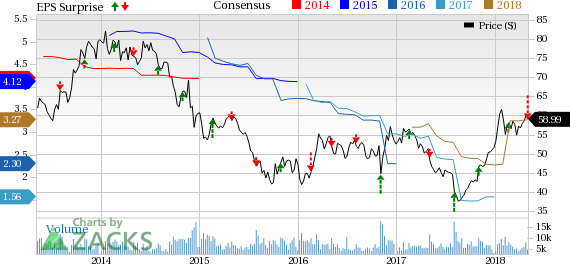
Fluor Corporation Price, Consensus and EPS Surprise | Fluor Corporation Quote
Revenues at the Government segment soared 73.5% year over year to $1,327.2 million. The improvement in revenues were supported by the execution and substantial completion of task order awards for the U.S. Army Corps of Engineers in Puerto Rico. New awards in the quarter totaled $43 million.
Diversified Services revenues increased 13% to $643.3 million on a year-over-year basis, reflecting growth in revenues from Stork operations in Latin America and North America. The segment’s new awards came in at $433 million.
Meanwhile, revenues from the Energy & Chemicals segment were down 8.7% year over year to $1,943 million. In the reported quarter, the segment booked new awards of $721 million.
Mining, Industrial, Infrastructure & Power segment's revenues recorded a decline of 33.7% year over year to $910.3 million, reflecting lower volume of project execution activities in power. New awards came in at $1.3 billion including a mine expansion project in Peru.
In the reported quarter, Fluor's total new awards recorded an increase of 9.6% to $2.5 billion on a year-over-year basis.
At the end of the reported quarter, consolidated backlog was $29.1 billion, down from $41.6 billion in the year-ago quarter.
Liquidity & Shares Repurchases
As of Mar 31, 2018, Fluor had cash and marketable securities (including non-current) of $1,828.5 million, down from $2,078.8 million as on Dec 31, 2017. Long-term debt at the end of first-quarter 2018 increased to $1,607.7 million from $1,591.6 million as on Dec 31, 2017.
Furthermore, on May 2, 2018, the company declared a quarterly cash dividend of 21 cents per share payable on Jul 3 to stockholders of record as of Jun 1.
2018 Guidance Cut
Concurrent with first-quarter results, the company revised 2018 guidance. For 2018, it currently projects earnings per share in the range of $2.10-$2.50 compared with its previous guided range of $3.10-$3.50.
Our Take
Fluor’s leading position in nuclear remediation at government facilities bodes well for its future growth. The company also anticipates an increase in front-end engineering awards, moving ahead, which is expected to boost growth. Moreover, the company’s investment projects are encouraging, particularly its LNG projects in North America, including the LNG Canada project for Shell (LON:RDSa), chemical facilities as well as pipeline projects in the United States.
Moreover, the company enjoys a solid track record of receiving awards, and management remains optimistic about continuation of this trend in future as well. This is expected to drive growth for the company.
Fluor carries a Zacks Rank #2 (Buy).
Other Stocks to Consider
Some other top-ranked stocks in the same space include Willdan Group, Inc. (NASDAQ:WLDN) , Jacobs Engineering Group Inc. (NYSE:JEC) and KBR, Inc. (NYSE:KBR) . All these companies carry a Zacks Rank #2. You can see the complete list of today’s Zacks #1 Rank (Strong Buy) stocks here.
Willdan Group has an excellent earnings surprise history. The company surpassed estimates in the trailing four quarters, with an average beat of 45.4%.
Jacobs Engineering Group has an impressive earnings surprise history. The company exceeded estimates in the trailing four quarters, with an average beat of 11.4%.
KBR has a decent earnings surprise history. The company outpaced estimates thrice in the trailing four quarters, with an average beat of 14.1%.
Today's Stocks from Zacks' Hottest Strategies
It's hard to believe, even for us at Zacks. But while the market gained +21.9% in 2017, our top stock-picking screens have returned +115.0%, +109.3%, +104.9%, +98.6%, and +67.1%.
And this outperformance has not just been a recent phenomenon. Over the years it has been remarkably consistent. From 2000 - 2017, the composite yearly average gain for these strategies has beaten the market more than 19X over. Maybe even more remarkable is the fact that we're willing to share their latest stocks with you without cost or obligation.
Jacobs Engineering Group Inc. (JEC): Free Stock Analysis Report
Fluor Corporation (FLR): Free Stock Analysis Report
KBR, Inc. (KBR): Free Stock Analysis Report
Willdan Group, Inc. (WLDN): Free Stock Analysis Report
Original post
Zacks Investment Research