
FLIR Systems Inc.’s (NASDAQ:FLIR) third-quarter 2017 adjusted earnings per share came in at 52 cents, surpassing the Zacks Consensus Estimate of 48 cents. The figure rose 8.3% over the prior-year quarter figure on solid top-line growth.
Adjusted net income in the quarter came in at $72.7 million compared with $65.6 million in the year-ago quarter. The year-over-year increase can primarily be attributed to the company’s impressive top-line performance.
Inside the Headlines
FLIR Systems’ top-line grew a robust 14.7% year over year to $464.7 million. Further, revenues beat the Zacks Consensus Estimate of $446 million comfortably. Strong growth across all the segments drove the overall top line.
As for the segments, Surveillance segment revenues rose 7.6% year over year to $146.8 million. Revenues from the Instruments segment came in at $91.4 million, up 10.5% on a year-over-year basis. OEM & Emerging Markets revenues rose an impressive 39.1% over the prior-year quarter to $87.2 million. The segment’s revenues were driven by the addition of the Integrated Imaging Solutions line of business from the Point Grey Research, acquired in fourth-quarter 2016.
The Detection segment revenues surged 18.9% year over year to $31.4 million, bolstered by timing of DR-SKO program shipments. Maritime segment revenues were also up 4.2% year over year to $42.3 million. Moreover, revenues from the Security segment advanced 16.5% over the prior-year quarter to $65.7 million.
FLIR Systems' order backlog for the coming 12 months is pegged at around $709 million as of Sep 30, 2017, reflecting a solid year-over-year increase of 10.1%.
Adjusted operating income came in at $101.1 million, compared with $89 million in the prior-year quarter. Sturdy top-line growth drove the rise in income.
FLIR Systems, Inc. Price, Consensus and EPS Surprise
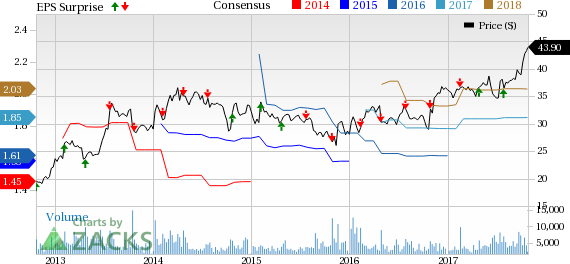
FLIR Systems, Inc. Price, Consensus and EPS Surprise | FLIR Systems, Inc. Quote
Liquidity & Cash Flow
As of Sep 30, 2017, the company's cash and cash equivalents were $437 million, compared with $677.7 million as of Sep 30, 2016. Long-term debt was $420.4 million, down from $501.9 million at Dec 31, 2016.
Cash flow generated from operating activities in the quarter came in at $104.1 million, significantly up from $88.8 million in the prior-year quarter.
Outlook
Concurrent with the third quarter earnings release, FLIR Systems tweaked guidance for 2017. The company now projects adjusted earnings per share in the range of $1.83-$1.88, compared with its prior guidance of $1.81-$1.91 per share. Moreover, the company reiterated revenue guidance in the range of $1.78 billion to $1.83 billion.
Our Take
FLIR Systems’ diverse portfolio has been a staple growth driver, helping it offset weaknesses associated with any one market. The company’s restructuring efforts in the past five years have allowed it to streamline business operations and optimize growth. Key metrics like revenues, operating income, operating margin and adjusted EPS have materially benefited from such actions. We anticipate this trend to continue in the upcoming quarters as well.
However, the fact remains that strong competition from various big and small industry players remains a threat to the company’s financials. Identification of new applications for thermal imaging depending on customer needs, along with development of commercial quantities at reasonable costs, remains a primary challenge for all companies operating in this sector.
FLIR Systems currently carries a Zacks Rank #3 (Hold).
Stocks to Consider
Some better-ranked stocks worth considering in the same space include AeroVironment, Inc. (NASDAQ:AVAV) , The Boeing Company (NYSE:BA) and Raytheon Company (NYSE:RTN) . While AeroVironment sports a Zacks Rank #1 (Strong Buy), The Boeing Company and Raytheon carry a Zacks Rank #2 (Buy). You can see the complete list of today’s Zacks #1 Rank stocks here.
AeroVironment has an excellent earnings surprise history, surpassing estimates thrice in the trailing four quarters with an average beat of 49.7%.
The Boeing Company has an excellent earnings surprise history, exceeding estimates in the trailing four quarters with an average beat of 13.7%.
Raytheon has posted earning beat thrice in the preceding four quarters. It boasts an average beat of 7.9%.
Zacks' Hidden Trades
While we share many recommendations and ideas with the public, certain moves are hidden from everyone but selected members of our portfolio services. Would you like to peek behind the curtain today and view them?
Starting now, for the next month, I invite you to follow all Zacks' private buys and sells in real time from value to momentum...from stocks under $10 to ETF to option movers...from insider trades to companies that are about to report positive earnings surprises (we've called them with 80%+ accuracy). You can even look inside portfolios so exclusive that they are normally closed to new investors.
Click here for Zacks' secret trade>>
Boeing Company (The) (BA): Free Stock Analysis Report
AeroVironment, Inc. (AVAV): Free Stock Analysis Report
FLIR Systems, Inc. (FLIR): Free Stock Analysis Report
Raytheon Company (RTN): Free Stock Analysis Report
Original post
Zacks Investment Research