Banking technology giant Fiserv (NASDAQ:FISV) stock has been grinding towards all-time highs as a beneficiary of the rapid adoption of digital transactions accelerated by the pandemic. The Company controls the majority of core banking systems as end users rely on their platform to be able to make mobile deposits and transactions.
Literally all major U.S. banks are locked into the Fiserv banking platform making it too costly and risky to migrate elsewhere. Top money center banks like JPMorgan Chase (NYSE:JPM), Wells Fargo (NYSE:WFC), and Citigroup (NYSE:C) have been Fiserv customers for over three decades and its acquisition of First Data puts Fiserv at the core of 90% of the banking systems.
This dominance is here to stay for the foreseeable future. The Company continues to expand its reach internationally while expanding margins with its own digital transformation. Prudent investors looking for exposure in the growth of digital banking can look for opportunistic pullbacks to consider scaling into a position.
Q4 2020 Earnings Release
On Feb. 9, 2021, Fiserv released Q4 2020 results for the quarter ending in December 2020. The Company reported earnings per share (EPS) of $1.30 excluding non-recurring items, beating consensus analyst estimates of $1.29, by $0.01. Revenues fell (-5.3%) year-over-year (YoY) to $3.83 billion, missing analyst estimates for $3.97 billion. GAAP revenues grew 46% YoY for the full-year 2020. Adjusted EPS grew 12% for the full-year 2020. Free cash flow increased 7% to $1.05 billion in Q4 and 11% to $3.65 billion for full-year 2020. Full-year numbers include the impact of revenues from the First Data acquisition.
Mixed Full-Year 2021 Guidance
Fiserv provided lowered guidance for full-year 2021 adjusted EPS growth of 20% to 24% in the range of $5.30 to $5.50 from $5.33 to $5.55 versus $5.38 consensus analyst estimates. The Company raised full-year 2021 revenues to grow 8% to 12% in the range of $15.7 billion to $16.6 billion versus $15.84 billion analyst consensus.
Conference Call Takeaways
Fiserv CEO, Frank Bisignano, set the tone:
“Now, I like to update you on how our leading digital enabled merchant business is performing. Through Clover, our leading SMC platform; Carat, our enterprise omni-channel commerce solution; and Clover Connect, our rich ISV Solutions set… The momentum within the digital-enabled segments of the merchant business continues to be excellent. Clover’s gross payment volume grew 25% to $34 billion in the quarter or $135 billion annualized… Carat, so our continued growth with global e-commerce transaction is up about 25% both in the quarter and a full year. We saw our omni-channel transactions such as order ahead and pick up in store grow more than 125% year-over-year with some of our best known quick service restaurant clients seeing excellent growth.”
He went on to detail winning 46 new enterprise-level e-commerce client including Overstock (NASDAQ:OSTK) and Wingstop (NASDAQ:WING) in North America. The Company signed Total for global digital payments services, which is one of the world’s largest energy providers to more than 100 countries.
Synergy Sales
CEO Bisignano underscored the power of synergies with their services, partnerships and acquisitions generating additional sales at scale, synergy sales. A notable example was the strengthening its “longstanding partnership” with PayPal (NASDAQ:PYPL) integrating it as a payment option for Fiserv billers, which he deems a “notable synergy sale”. Synergy sales brought in $215 million in annualized revenues as the Company plans to exceed its target of $600 million. The Company added 45 new bank merchant clients for a total of 231 new clients since the merger. Synergy sales combined with enabling clients to accelerate their digital transformation and bolster its digital innovation are the growth drivers for this legacy giant that moves like a fintech.

FISV Opportunistic Pullback Levels
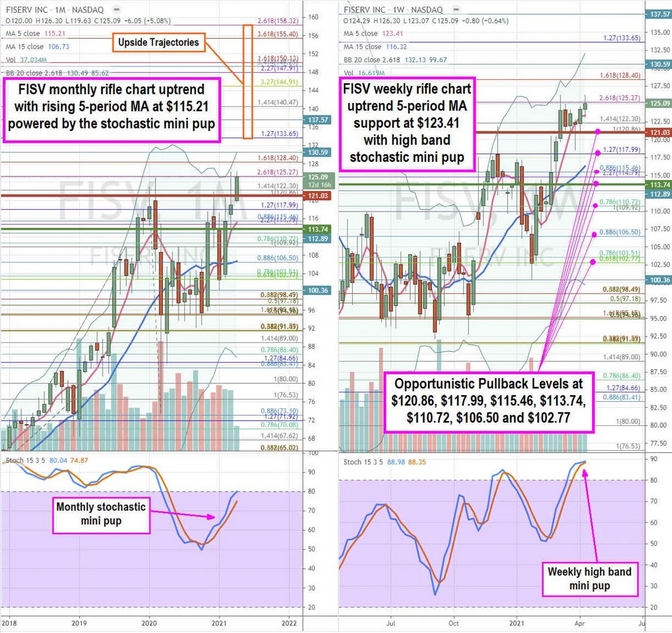
Using the rifle charts on monthly and weekly time frames provides a broader view of the landscape for FISV stock. The monthly rifle chart is in a breakout with a rising 5-period moving average (MA) at the $115.46 Fibonacci (fib) level. The monthly stochastic mini pup targets the monthly upper Bollinger Bands (BBs) at $130.59. The weekly rifle chart is also uptrending with a rising 5-period MA support at $123.41, but the stochastic is at a very high band attempting to mini pup at the 90-band for a climactic squeeze. The weekly market structure high (MSH) sell triggers under $121.03, which would form a channel tightening back down to the weekly 15-period MA at $116.32 and the market structure low (MSL) buy trigger at $113.74. Prudent investors can monitor the weekly stochastic peak and potential crossover down for Opportunistic pullback levels at the $120.86 fib, $117.99 fib, $115.46 fib, $113.74 weekly MSL trigger, $110.72 fib, $106.50 fib, and the $102.77 fib. Upside trajectories range from the $133.65 fib upwards to the $158.32 fib level.
