What a day on the FX markets. I am sure that most reading this note would have been involved in USD/JPY, the JPY crosses, or some other pair in the FX universe.

I was on YourMoney (Foxtel) talking about currency moves when the interviewer questioned me on my views of AUDUSD trading around 67.5c, and I had to do a double-take. Just before going on air it was just through 70c, and I assumed he had made a mistake, subsequently asking, on air, if he could quote me USDJPY and AUDJPY. He did, after which I guessed we had seen a liquidity event in a period labelled the ‘twilight zone’. This is effectively the period between the close of the US markets and the open of Asia, where liquidity can drop away, and to make things worse, Tokyo was closed.
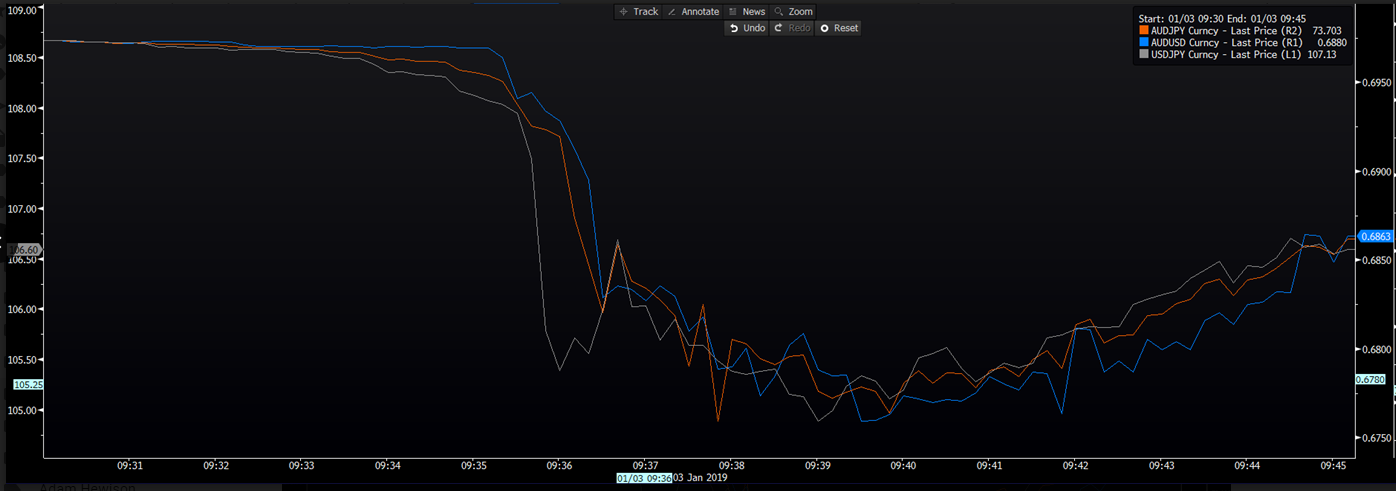
As I discuss in the video, what started as concerns around global growth has pushed a number of pairs into key levels, where obvious and no doubt sizeable stop orders were placed. When married with a poor tape in S&P 500 and NASDAQ futures, thanks largely to a Q1 revenue guidance downgrade from Apple (NASDAQ:AAPL), we saw USDJPY, and the JPY crosses breaking prior lows and having a monster move, with AUDUSD and other FX pairs following with algo’s closing the arb. The lack of liquidity and additional offers from algo’s caused a vacuum, sucking these pairs aggressively lower.

As with prior ‘flash crashes’, the move often doesn’t last long, and we have seen buyers stepping in, although traders seem cautious to step in front of this, and many are just waiting to see if vols settle down a touch.
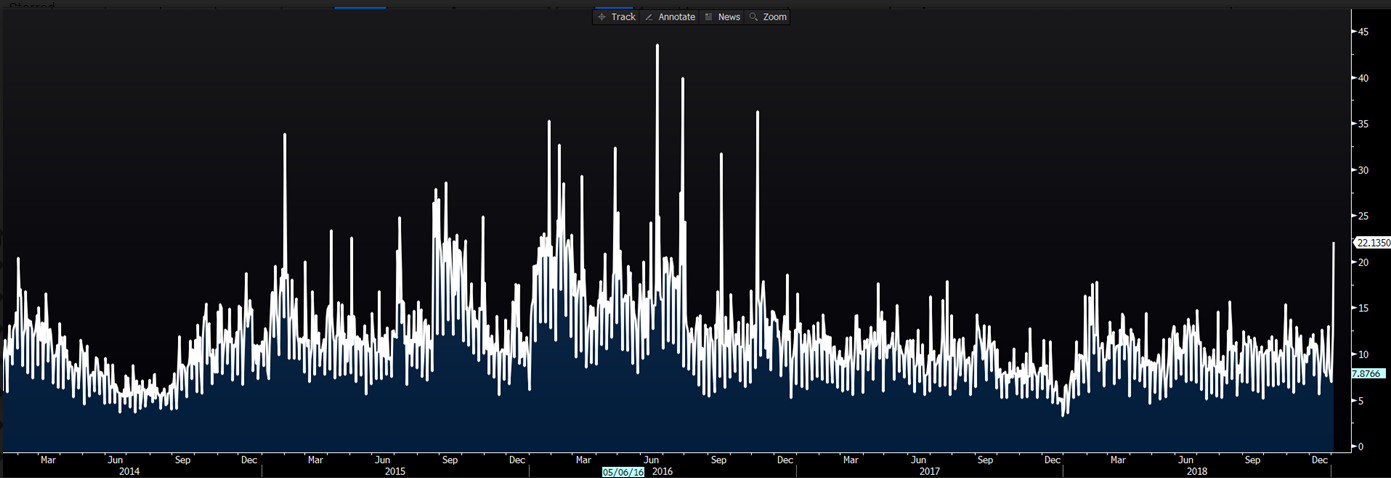
As we can see from the chart, it seems like this was led USDJPY, with price accelerating through 108. AUDJPY had the biggest percentage move in G10 FX, and overnight implied volatility (see the Bloomberg chart directly below) now sits at 22%, which gives us an implied move in the session ahead of 108-points, which obviously pales insignificant relative to what we saw this morning, but it does suggest traders do see heightened risks ahead of US ISM manufacturing, US payrolls and the Fed chair’s Q&A session.

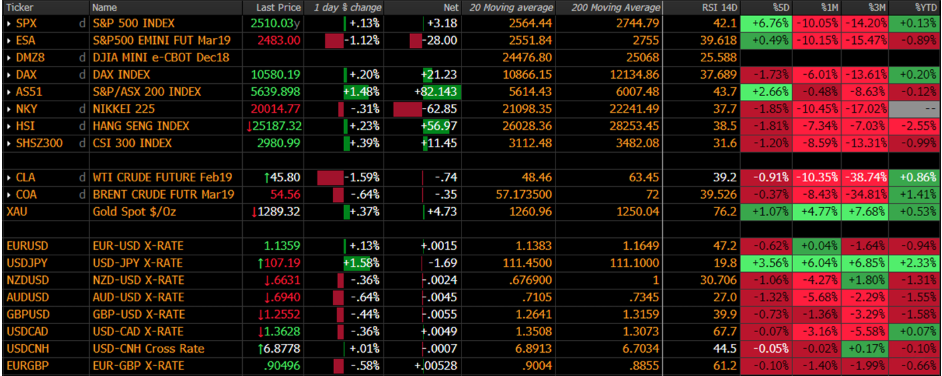
Interestingly, while Nikkei futures are 1.9% lower (the cash market is 1.9% lower), Chinese equities are higher and the ASX 200 is doing very well indeed, with a gain of 1.5%. What's more, it is not just stocks sensitive to a weaker AUD, as breadth is good, with 83% of stocks higher on the day, albeit on value 22% below the 30-day average. Energy has flown here, and it feels like the Saudi’s are trying their best to tighten the oil market to support prices.
Let’s see how the next two days play out, but given S&P 500 futures are 1.5% lower (at time of writing) and NASDAQ futures are down almost 2.5%, one would argue the ASX 200 should be selling off, especially in light of the earlier FX shenanigans. Equity bulls will take this all day long.
