When looking at portfolio performance as of August 31, Microsoft (NASDAQ:MSFT), clients' largest holding, performed pretty well in the month of August, +3.5%, and year-to-date was up over 21%, versus the S&P 500’s +10.5%.
Then we get to client’s #2 holding, Charles Schwab (NYSE:SCHW), and it hasn’t performed so well: Schwab was down roughly 1% as of August 31 (YTD).
As has been detailed on this site over the years, the reason for the Technology and Financial sector weightings, within client accounts, with overweights relative to the S&P 500 sector weights, is that the Technology and Financial sectors suffered their bear markets from 2000 through 2009, and thus – in my opinion – represent better risk / reward propositions today, than in the 1990’s.
The two sectors today still offer good relative value, but with lower growth and overall lower multiples.
Here is the YTD return of the top 3 Financial names in client accounts:
The Financial sector has been maddening with the bull market that started in either March, 2009 or 2013 (take your pick), with longer periods of under-performance, seemingly tied to the inability of the 10-year and 30-year Treasury yields to rise, and the yield curve to steepen.
A good example is 2013: even GE beat the S&P 500’s 32% gain in 2013, rising 35% as it’s still-intact GE Capital division was seemingly aided by the jump in the 10-year Treasury yield to 3% and the steepening of the curve on Ben Bernanke’s “taper tantrum”. Schwab rose 75% that calendar year, JP Morgan rose 34%, and Goldman Sachs rose 36%.
Then Financials trailed again, until the rally after Brexit and post-election in late 2016 and early 2017, and now the sector lags once again.
Josh Brown had a good point in one of his regular appearances on CNBC’s “The Halftime Show” seen everyday around lunch time: Josh made the point that with tight credit spreads, record corporate bond issuance, increased although somewhat suspect IPO activity (meaning the IPOs being seen are not the quality seen during typical bull markets), steady interest rates, and record stock prices, Financials – even given the Dodd-Frank restrictions – should be minting money (i.e. earnings and revenue growth), particularly broker-dealers.
But they aren’t – Goldman Sachs being a prime example, down 7% YTD on a record year for stock prices and bond issuance.
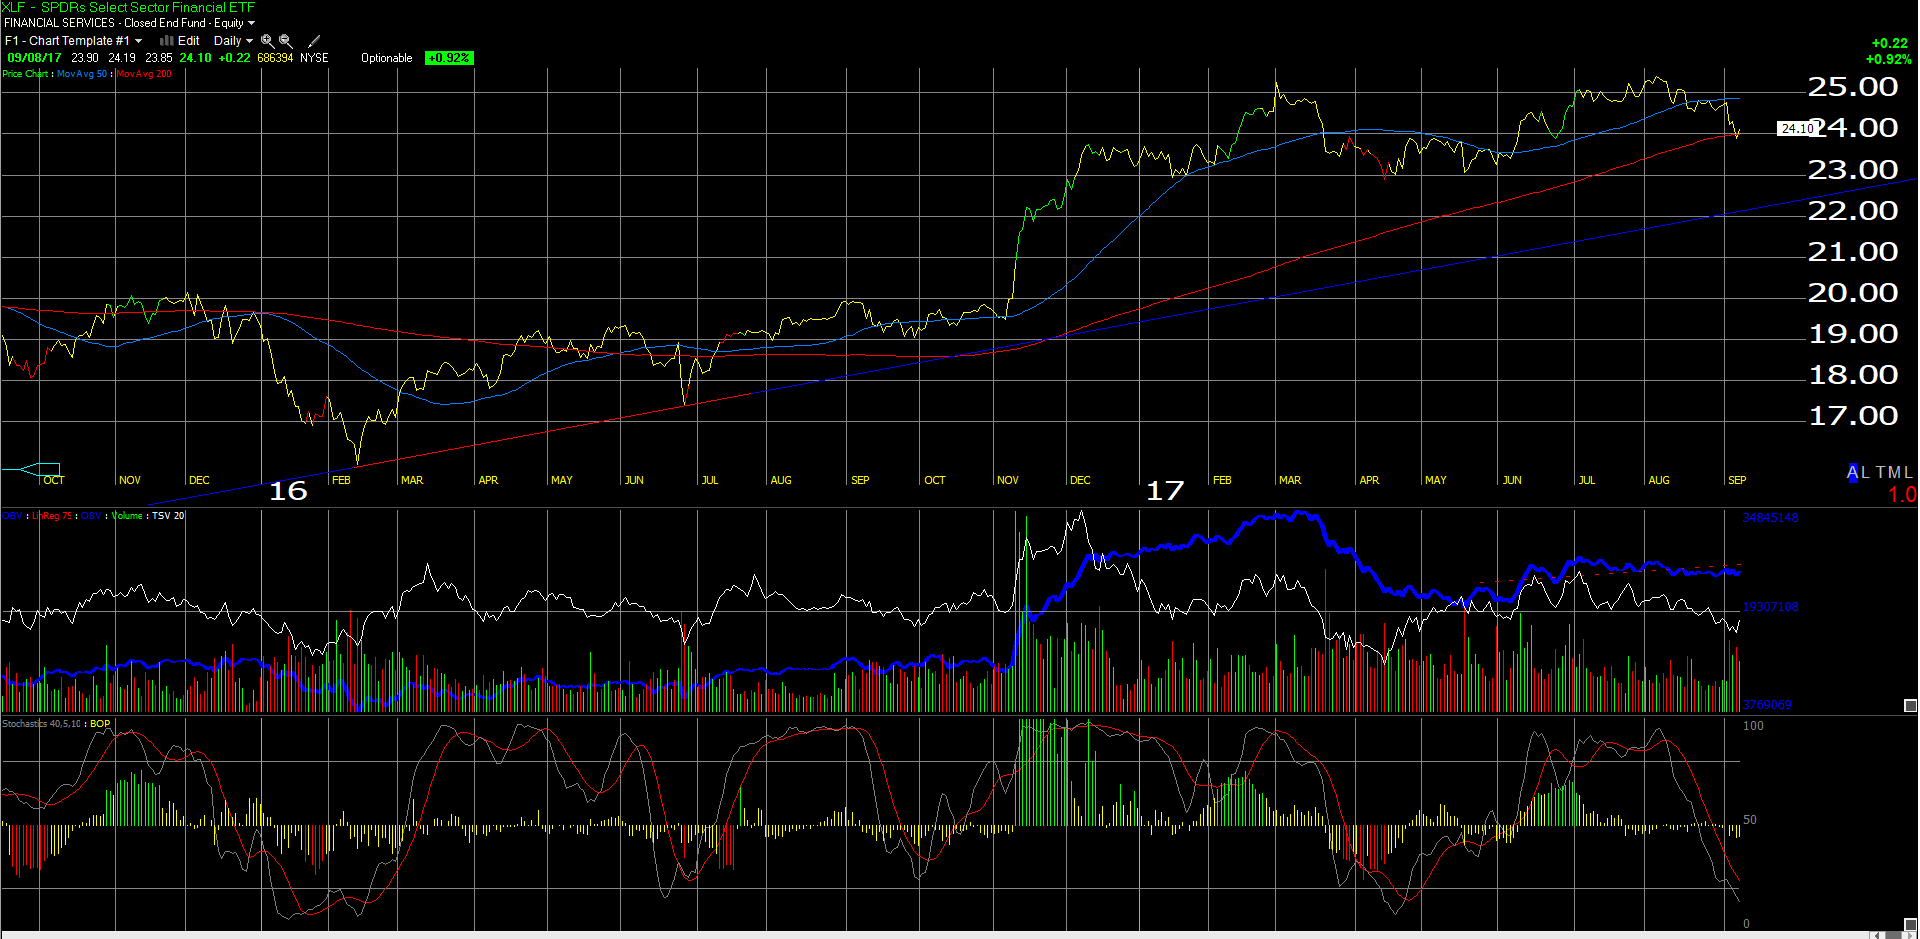
Here are two interesting charts:


The first chart is our Worden technical software featuring our daily chart of the Financial Select Sector SPDR ETF (NYSE:XLF), showing the financial sector ETF holding its 200-day moving average on Friday, September 8th. However, using the trend-line off the Q1 ’16 low, Financials could sink further and the 2016 rally could be intact.
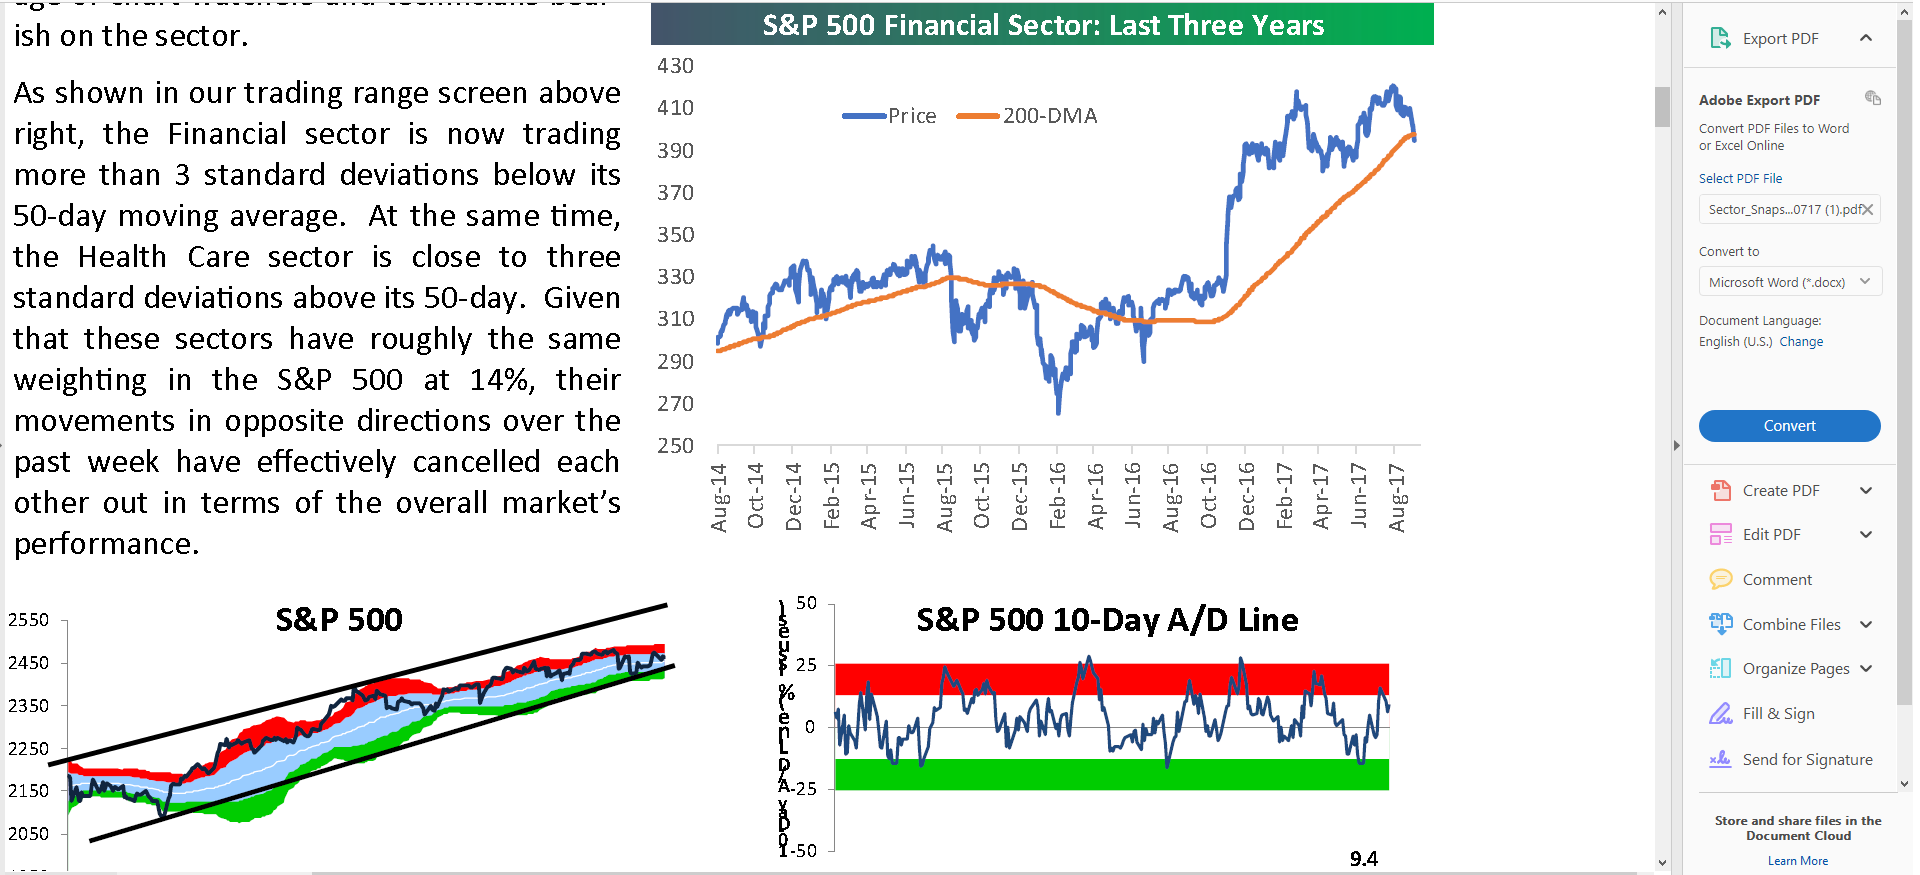
The 2nd chart is more interesting: being technologically-challenged as I am, this is a shrunken “cut-and-paste” of Bespoke’s weekly “Sector Snapshot” published every Thursday night, this snapshot being published September 7th, 2017,
Note the Financial sector trend line, but also note the paragraph next to it, where Bespoke notes that Financials are trending 3-standard deviations below their 50-day moving average.
Analysis / conclusion: Here is a two-part blog post done on the Financials in late May ’17, part I here, and part II here. Although the analysis is long-winded and a little convoluted, the Financial sector is at a critical point once again, just 90 days later.
While Schwab and JP Morgan will likely retain their weights in client accounts, I worry about Goldman longer-term. That is a business model based on the 1980’s and 1990’s bull market. The stock is caught in a trading range between $210 and $250, $250 being the all-time-high from early November, 2007, so a case could be made that Goldman has completed a 10-year “double-top” on the charts. Goldman caught an upgrade on Friday, September 8th as a sell-side analyst thinks the banking and trading giant is entering higher-multiple businesses, but we’ll have to see. Both the S&P 500 and the Barclays (LON:BARC) Aggregate are up nicely this year, and Goldman is lagging badly.
Still a believer that Financials work longer-term since I do think Financial sector earnings and growth rates will improve over time. Maybe not to ’90’s levels, but certainly better than the post-2009 low-single-digit growth rates.
However, interest rates do need to rise and the yield curve needs to steepen, both likely driven by faster economic growth.
Being overweight the sector has been very frustrating over the years, but it looks set for a bounce here shortly.
