Get 40% Off
👀 👁 🧿 All eyes on Biogen, up +4,56% after posting earnings. Our AI picked it in March 2024.
Which stocks will surge next?
Unlock AI-picked Stocks

Financials & Tech Continue To Lead US Sectors For 1-Year Return

Published 08/23/2017, 10:08 AM
Updated 07/09/2023, 06:31 AM

Financial and technology stocks remain the top sector performers for the trailing one-year period, based on a set of ETFs. The bullish momentum has cooled in recent weeks for these equities, but the same is true for the market generally, leaving the two sectors comfortably in the lead vs. the rest of the field.

Echoing last month’s update, Financial Select Sector SPDR (NYSE:XLF) still holds the top spot for one-year results. Although it’s off its recent highs, XLF’s total return is currently a sizzling 29.5% for the year through Tuesday (Aug. 22).

Technology Select Sector SPDR (NYSE:XLK) is almost as strong, posting a 25.2% total return for the past year.

In relative terms, the one-year returns for XLF and XLK translate into hefty premiums vs. the US stock market overall, based on SPDR S&P 500 (MX:SPY (NYSE:SPY)), which is up 14.6% over the past 12 months.

Red ink for one-year results is currently limited to Energy Select Sector SPDR (XLE (NYSE:XLE)). August so far has been an especially rough month for energy stocks. For the trailing one-year change, XLE is down 8.2%.
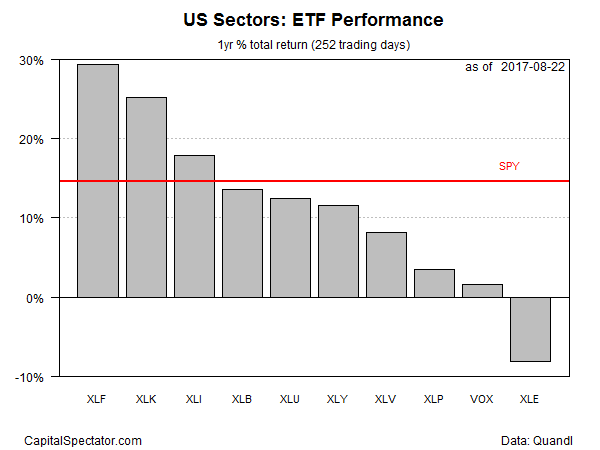
US Sectors : ETF Performance

The next chart below offers another review of how the sector ETFs have fared in relative terms via rebased performance indexes with a year-ago start date of Aug. 22, 2016. The obvious outliers: the financial ETF’s red-hot run (black line at top) and energy’s accelerating slump of late (purple line at bottom).
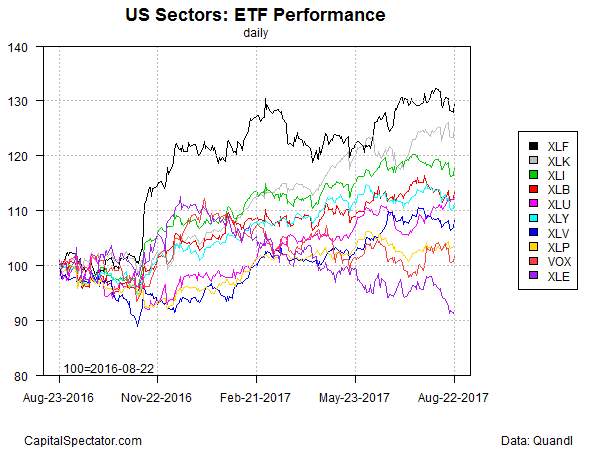
US Sectors ETF Performance Daily Chart

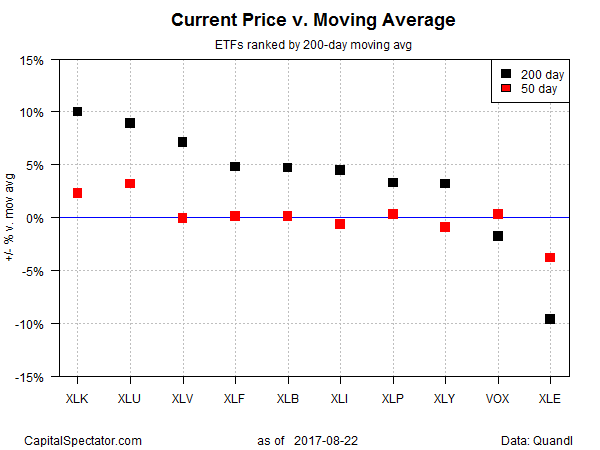
Ranking the sector ETFs by price relative to 200-day moving average shows that tech’s bull run is in first place. The number-two performer for current premium over the 200-day average is Utilities Select Sector SPDR (NYSE:XLU), which edged up to a record high yesterday. Financials, on the other hand, reflect a relatively middling performance by this ranking.
3rd party Ad. Not an offer or recommendation by Investing.com. See disclosure here or remove ads .

Current Price V Moving Average

Tech is also in the top spot when ranking returns through a risk lens via the Sharpe ratio, a metric that adjusts performance based on trailing volatility (standard deviation). Higher Sharpe ratios indicate stronger risk-adjusted performance. Reviewing daily returns for the past 12 months puts XLK is in the lead with a 2.2 profile at the moment — slightly ahead of financials and well above the broad equity market’s 1.7 Sharpe ratio (based on SPY’s daily returns for the past year).
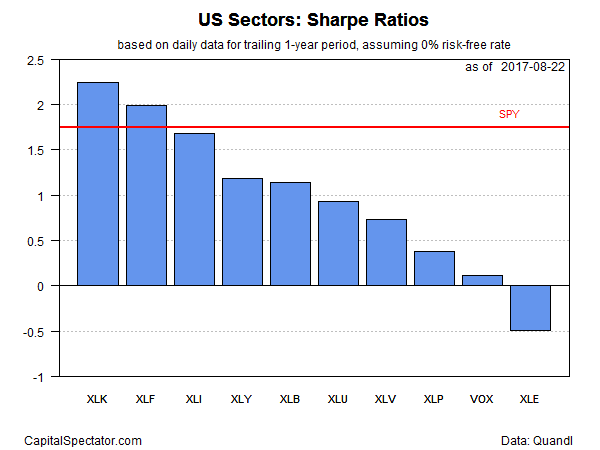
US Sectors Sharpe Ratios

Latest comments

Risk Disclosure: Trading in financial instruments and/or cryptocurrencies involves high risks including the risk of losing some, or all, of your investment amount, and may not be suitable for all investors. Prices of cryptocurrencies are extremely volatile and may be affected by external factors such as financial, regulatory or political events. Trading on margin increases the financial risks.
Before deciding to trade in financial instrument or cryptocurrencies you should be fully informed of the risks and costs associated with trading the financial markets, carefully consider your investment objectives, level of experience, and risk appetite, and seek professional advice where needed.
Fusion Media would like to remind you that the data contained in this website is not necessarily real-time nor accurate. The data and prices on the website are not necessarily provided by any market or exchange, but may be provided by market makers, and so prices may not be accurate and may differ from the actual price at any given market, meaning prices are indicative and not appropriate for trading purposes. Fusion Media and any provider of the data contained in this website will not accept liability for any loss or damage as a result of your trading, or your reliance on the information contained within this website.
It is prohibited to use, store, reproduce, display, modify, transmit or distribute the data contained in this website without the explicit prior written permission of Fusion Media and/or the data provider. All intellectual property rights are reserved by the providers and/or the exchange providing the data contained in this website.
Fusion Media may be compensated by the advertisers that appear on the website, based on your interaction with the advertisements or advertisers.
© 2007-2024 - Fusion Media Limited. All Rights Reserved.