
Next CFTC reports will be released on November 27th. In this regard, today our review will be based only on horizontal levels and technical analysis.
E-Mini S&P 500 (ESZ17)
The trend is bullish and the impulse wave develops on the Daily timeframe. A pullback buying opportunity on the Daily timeframe will be formed after the correction formation. Long positions will remain relevant until the market is above the nearest support level on the Daily timeframe, the lows of November 15-16.
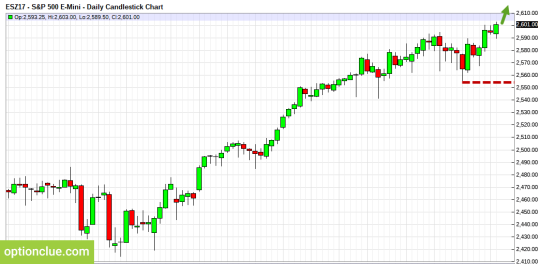
E-Mini S&P500 (ESZ17). Technical analysis and COT net position indicator.
American Dollar remains in downtrend and the impulse wave develops on the Daily timeframe. A pullback selling opportunity on the Daily timeframe will be formed after the correction formation and at the same time price movement is very active that’s why the reliable market entry is also possible on smaller timeframes. Short positions will remain relevant until the market is below the nearest resistance level on the Daily timeframe, the highs of November 20-22.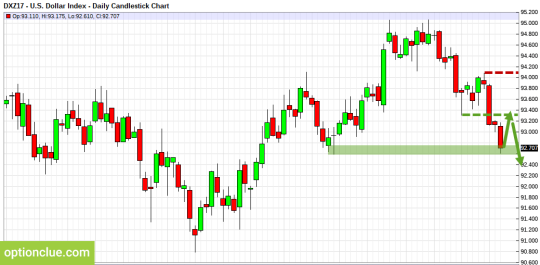
Dollar Index (DXY). Technical analysis and COT net position indicator.
Euro (EUR/USD)
Dollar is actively falling and EUR/USD currency pair is rising. The Daily trend is bullish and another correction came to an end last week and the impulse wave develops. Long positions will remain relevant until the market is above the nearest support level on the Daily timeframe, the lows of November 20-22.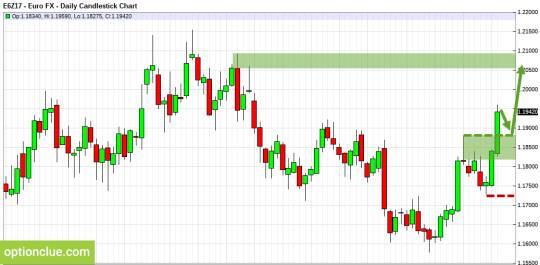
EURUSD. Technical analysis and COT net position indicator.
Swiss Franc (USD/CHF)
USD/CHF currency pair remains in the medium-term bearish trend and the impulse wave develops. USD/CHF short positions will remain relevant until the market is below the nearest resistance level, the highs of November 16-22. The next target is around the price mark of 0.9730.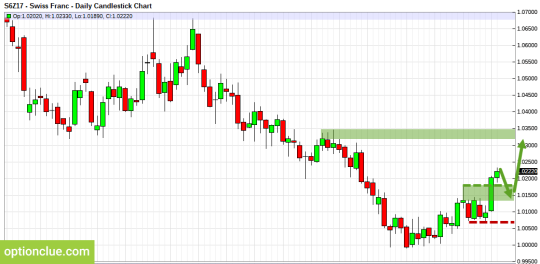
CHF/USD. Technical analysis and COT net position indicator.
British Pound (GBP/USD)
The resistance level was broken on the Daily timeframe on Wednesday, the trend is bullish now and the impulse wave develops. A pullback buying opportunity on the Daily timeframe will appear after the correction formation
.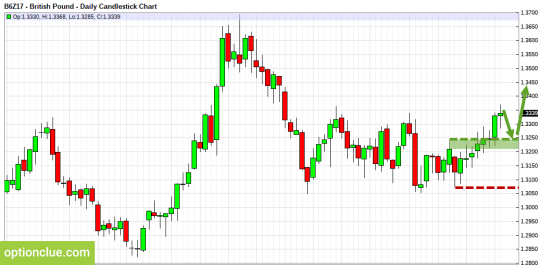
GBP/USD. Technical analysis and COT net position indicator.
Japanese Yen (USD/JPY)
USD/JPY currency pair remains in the medium-term downtrend and the impulse wave develops. USD/JPY short positions will remain relevant until the market is below the nearest resistance level, the highs of November 10-14. A pullback selling opportunity will appear after the correction formation on the Daily timeframe.
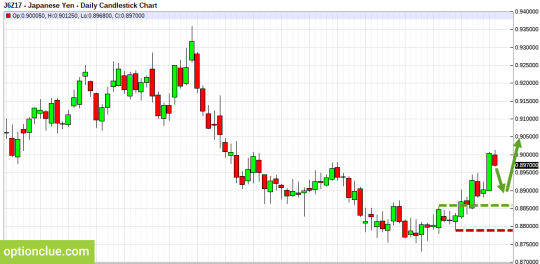
JPY/USD. Technical analysis and COT net position indicator.
WTI Crude Oil (CLF18)
The oil market remains in the medium-term uptrend and the impulse wave develops. Long positions will remain relevant until the market is above the nearest support level on the Daily timeframe, the lows of November 14-17. A pullback buying opportunity on the Daily timeframe will appear after another correction formation.
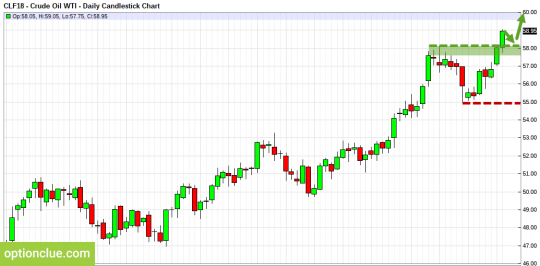
WTI (CLF18). Technical analysis and COT net position indicator.
Canadian Dollar (USD/CAD)
The trend is bullish (for USD/CAD), the market is in the correction. The price is around the support level on the Daily timeframe. USD/CAD pullback buying opportunity from this level will most likely appear within next week or it will be broken, the trend will change and USD/CAD breakout selling opportunity will be formed.
USD/CAD long positions will remain relevant until the market is above the nearest support level on the Daily timeframe, the lows of November 9-13. The next target is around the price mark of 0.775
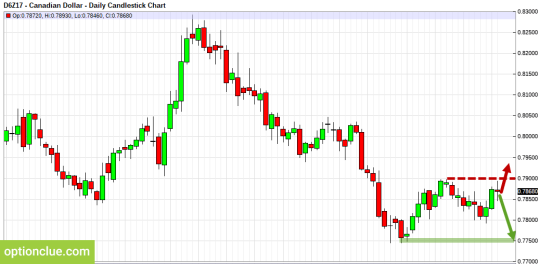
CAD/USD. Technical analysis and COT net position indicator.
Gold (XAU/USD)
The Daily trend is bullish, the correction came to an end last week and the impulse wave develops. Long positions will remain relevant until the market is above the nearest support level, the lows of November 17-21. The next target is around the price mark of $1305 per troy ounce.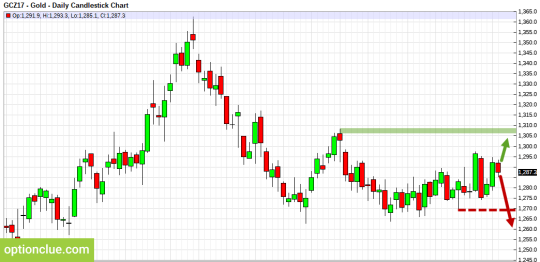
Gold. Technical analysis and COT net position indicator.
Silver (XAG/USD)
The silver market remains in the medium-term uptrend and the impulse wave develops. Long positions will remain relevant until the market is above the nearest support level on the Daily timeframe, the lows of November 20-21. The next target is $17.40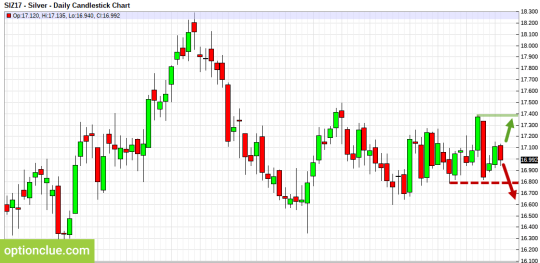
Silver. Technical analysis and COT net position indicator.
Australian Dollar (AUD/USD)
The market remains in downtrend and the correction is formed on the Daily timeframe. Short positions will remain relevant until the market is below the resistance level, the highs of November 8-10. The price is around the last broken level, in the near future the correction may come to an end and a pullback entry point may be formed.
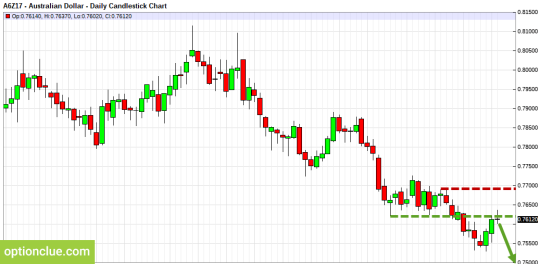
AUD/USD. Technical analysis and COT net position indicator.
New Zealand Dollar (NZD/USD)
The Daily trend is bearish and the correction wave is formed. A pullback signal may be formed on the Daily timeframe soon. Short positions will remain relevant until the market is below the resistance level, the highs of November 8-10.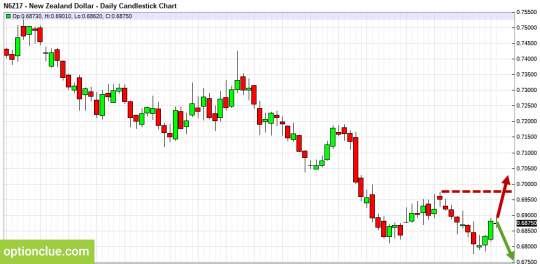
NZD/USD. Technical analysis and COT net position indicator.
Russian rouble (USD/RUB)
USD/RUB currency pair broke through the support level on the Daily timeframe on Wednesday, the trend is bearish now and the impulse wave develops. USD/RUB short positions will remain relevant until the market is below the nearest resistance level on the Daily timeframe, the highs of November 14-16.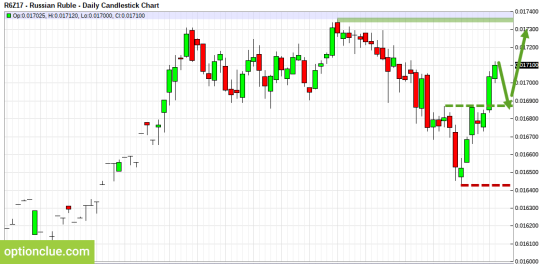
RUB/USD. Technical analysis and COT net position indicator.
Conclusions
In terms of medium-term trading, financial instruments with the correction close to completion on the Daily timeframe and with potentially the most promising risk-reward ratio are AUD/USD.
In the near future USD/JPY, GBP/USD, NZD/USD, USD/CNH, CHF/JPY can become noteworthy depending on the market correction depth.
Other financial instruments in the trade list may be also interesting, but in these markets pullback signals on the Daily timeframe are likely to occur no earlier than a week.
Good luck in trading!