
We make up the last medium-term trade list in 2017 and discuss the market condition based on CFTC reports and technical analysis.
The overview provides a description of the technical condition of the market on the most popular financial instruments, as well as information on the large speculators’ actions according to the last COT reports and the previous period.
If you want to use CFTC reports in your trading practice, you should understand that for an objective assessment of the situation it’s not enough to know the data of the last report. The dynamic is more important, in other words, comparing the statistics of large speculators’ actions in the current period with the previous one, so we mention both values.
E-Mini S&P 500 (ESH18)
The trend is bullish, another correction develops. Long positions will remain relevant until the market is above the nearest support level on the Daily timeframe, the lows of December 14-15.
COT net position indicator increased but didn’t reverse. Professionals’ opinion doesn’t correspond to the Daily trend direction and it makes sense to reduce the position size when an entry point appears in the trend direction.
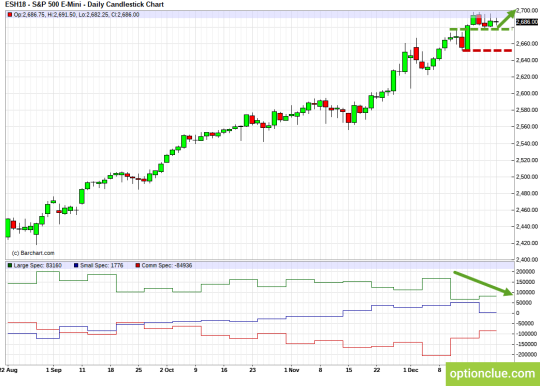
E-Mini S&P500 (ESH18). Technical analysis and COT net position indicator.
US Dollar Index (DXY)
American dollar remains in the uptrend. The market is around the support level on the Daily timeframe. A pullback buying opportunity from this level will most likely appear within next week or it will be broken, the trend will change and a breakout selling opportunity will be formed.
Long positions will remain relevant until the market is above the nearest support level on the Daily timeframe, the lows of December 20-22.
COT net position indicator increases and CFTC reports indicate that large speculators are actively buying and hedgers are selling and the professionals’ opinion corresponds to the Daily trend direction.
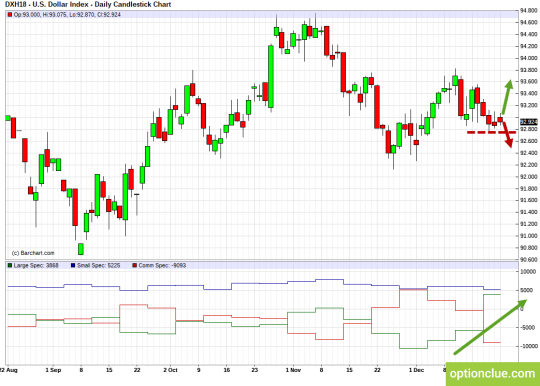
Dollar Index (DXY). Technical analysis and COT net position indicator.
Euro (EUR/USD)
EUR/USD currency pair broke through the resistance level on the Daily timeframe on Wednesday and the trend is bullish now and the correction wave develops. A pullback buying opportunity may be formed soon. Long positions will remain relevant until the market is above the support level, the lows of December 15-18.
COT net position indicator reversed and large speculators are selling and hedgers are buying. Professionals’ opinion doesn’t correspond to the trend direction and it makes to reduce the position size when an entry point appears in the trend direction.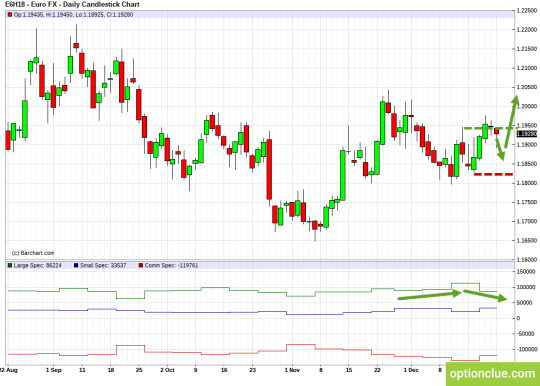
EUR/USD. Technical analysis and COT net position indicator.
Swiss Franc (USD/CHF)
USDCHF currency pair is in the triangle on the Daily timeframe. Before the fact of the nearest support or resistance level breakout new medium-term positions look unattractive. Previously opened USD/CHF long positions will remain relevant until the market is above the support level on the Daily timeframe, the lows of December 18-20.
CFTC reports indicate that large speculators are actively buying franc and hedgers are selling and the probability of breaking through the triangle down increases.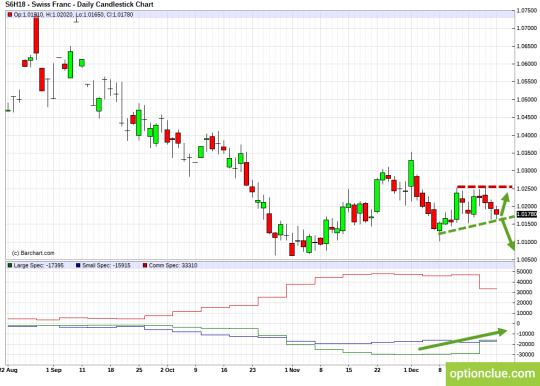
CHF/USD. Technical analysis and COT net position indicator.
British Pound (GBP/USD)
British pound is in the triangle. Before the fact of the nearest support or resistance level breakout new medium-term positions look unattractive. Previously opened GBP/USD long positions will remain relevant until the market is above the support level on the Daily timeframe, the lows of December 15-18.
CFTC reports indicate that large speculators go on buying pound and hedgers are selling and the probability of breaking through the triangle up increases.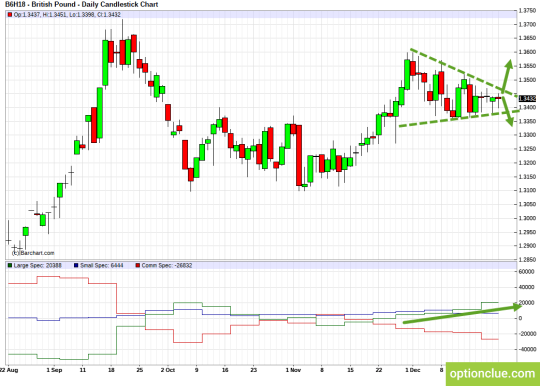
GBPUSD. Technical analysis and COT net position indicator.
Japanese Yen (USDJPY)
USDJPY currency pair remains in the medium-term uptrend and the correction develops. If the price goes on falling from current marks, a sideways trend will be formed on the Daily timeframe. Long positions will remain relevant until the market is above the support level, the lows of December 14-18. Large speculators’ opinion doesn’t correspond to the Daily trend direction.
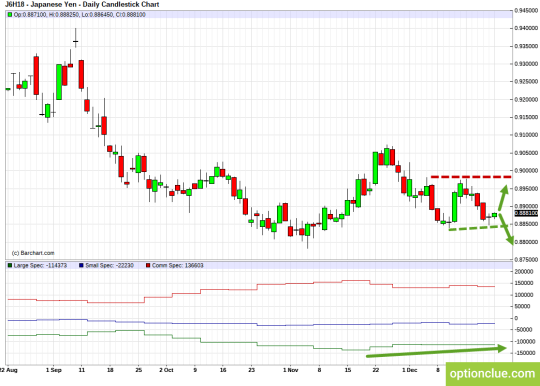
JPY/USD. Technical analysis and COT net position indicator.
WTI Crude Oil (CLG18)
The oil market remains in the downtrend, the price is around the resistance level on the Daily timeframe and the triangle is being formed. Short positions will remain relevant until the market is below the resistance level, the highs of December 11-12. If this level is broken, the trend will change and the breakout buying opportunity will be formed.
COT net position indicator decreased but didn’t reverse and the professionals’ opinion doesn’t still correspond to the Daily trend direction.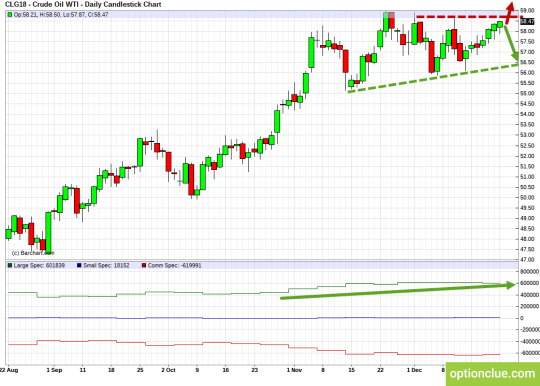
WTI Crude Oil (CLG18). Technical analysis and COT net position indicator.
Canadian Dollar (USD/CAD)
Canadian dollar fluctuates in the price range. At the same time the medium-term trend remains upward for USDCAD and another correction comes to an end
The market is around the support level on the Daily timeframe. A pullback buying opportunity from this level will most likely appear within next week or it will be broken, the trend will change and a breakout selling opportunity will be formed.
USDCAD long positions will remain relevant until the market is above the nearest support level on the Daily timeframe, the lows of December 14-15.
CFTC reports indicate that net position indicator reversed and large speculators began to buy Canadian dollar and hedgers began to sell. Professionals’ opinion doesn’t correspond to the market technical picture and it makes sense to reduce the position size when an entry point appears in the trend direction.
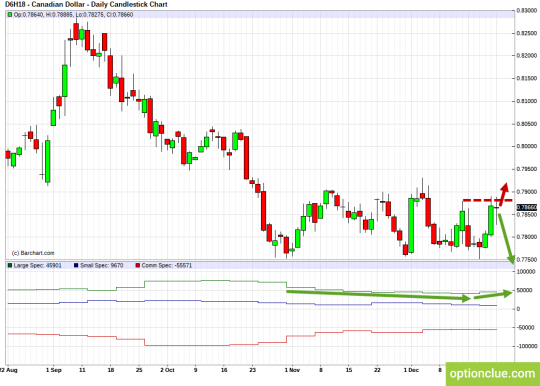
CAD/USD. Technical analysis and COT net position indicator.
Gold (XAU/USD) and silver (XAG/USD)
The gold and the silver markets remain in the medium-term downtrends and the corrections are formed on the Daily timeframe. Pullback selling opportunities on the Daily timeframe will appear after their completion. Short positions will remain relevant until the market is below the nearest resistance level, the highs of November 27-29 for the gold market and the highs of November 22-28 for the silver market.
The gold market is around the last broken level and the probability of a new impulse wave beginning from current price marks increases.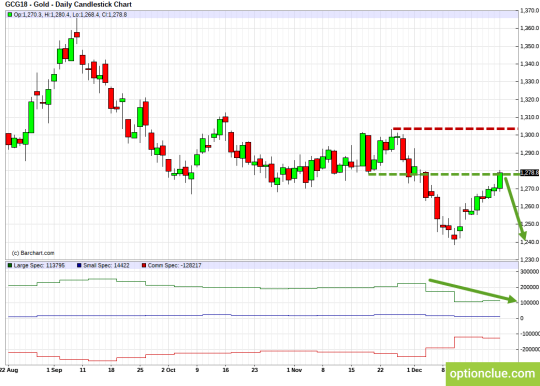
Gold (GCG18). Technical analysis and COT net position indicator.
Large speculators go on selling and hedgers are buying and the professionals’ opinion corresponds to the market technical picture.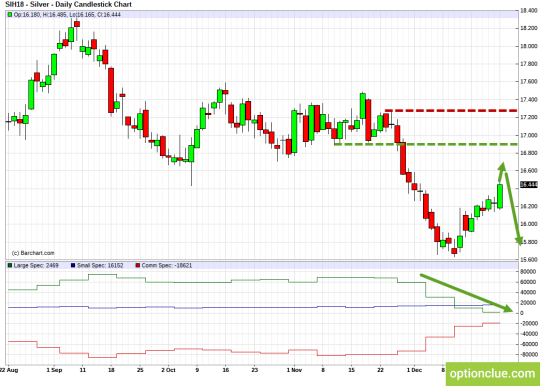
Silver (SIH18). Technical analysis and COT net position indicator.
Australian Dollar (AUD/USD)
Australian dollar remains in the uptrend. A pullback buying opportunity on the Daily timeframe will appear after the correction formation. Long positions will remain relevant until the market is above the support level, the lows of December 7-11.
COT net position indicator reversed and large speculators are actively selling and hedgers are buying. And it makes sense to reduce the position size when an entry point appears in the trend direction.
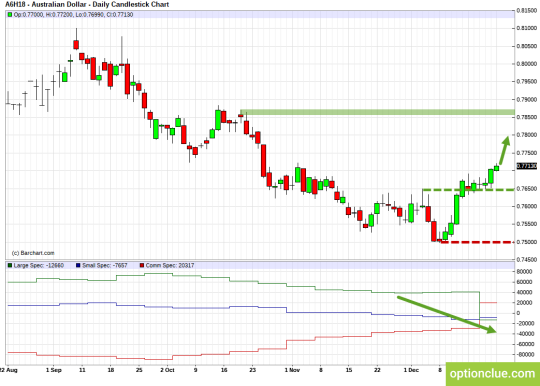
AUD/USD. Technical analysis and COT net position indicator.
New Zealand Dollar (NZD/USD)
The trend is bullish and the impulse wave develops. A pullback entry point will appear after the correction formation on the Daily timeframe. Purchases will remain relevant until the market is above the support level, the lows of December 21. CFTC reports indicate that professionals’ opinion corresponds to the market technical picture.
COT net position indicator reversed and large speculators are actively selling and hedgers are buying. And it makes sense to reduce the position size when an entry point appears in the trend direction.
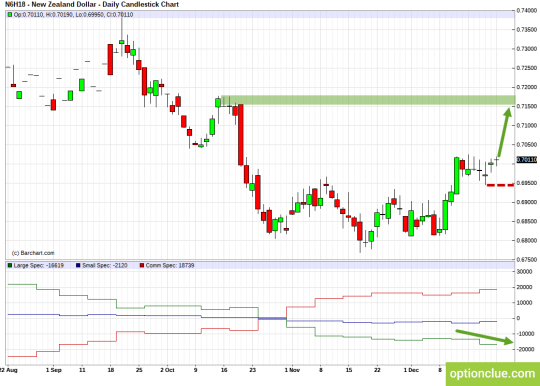
NZD/USD. Technical analysis and COT net position indicator.
Russian rouble (USD/RUB)
USDRUB currency pair remains in the medium-term bear trend and the impulse wave develops. Short positions will remain relevant until the market is below the resistance level, the highs of December 6-13.
Net position indicator increases and large speculators go on buying rouble, hedgers are selling and the professionals’ opinion still corresponds to the market technical picture.
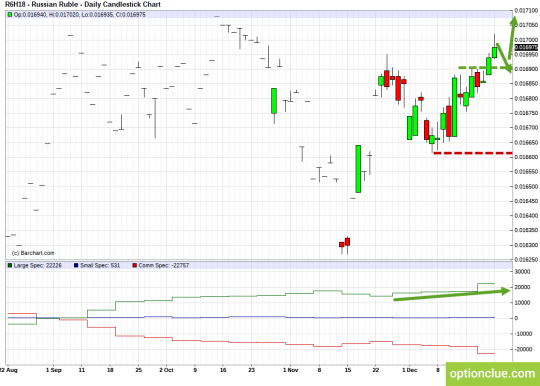
RUB/USD. Technical analysis and COT net position indicator.
Conclusions
Another trading period is nearing completion. On the eve of the New Year, markets often freeze, so market entry points on the Daily timeframe should generate really outstanding risk-reward ratio in order to be noteworthy. On smaller timeframes, there is some room for maneuver, but it will also gradually decrease.
We recommend that you reduce risk per trade, or stop your trading activity and return to the markets in early 2018. This is the last trade list in 2017. The new trading season will start in the first half of January, at this time one of the best medium-term entry points in the year take place.
In terms of medium-term trading, financial instruments with the correction close to completion on the Daily timeframe and with potentially the most promising risk-reward ratio are Gold, EUR/CAD, Dollar.
In the near future silver, EUR/JPY, EUR/CHF, EUR/AUD, EUR/USD can become noteworthy depending on the market correction depth.
Other financial instruments in the trade list may be also interesting, but in these markets pullback signals on the Daily timeframe are likely to occur no earlier than a week.
Good luck in trading!