Get 40% Off
🚨 Volatile Markets? Find Hidden Gems for Serious OutperformanceFind Stocks Now

Finally Russell 2000 Goes Bullish-But Can You Confirm?

Published 05/27/2021, 01:00 AM
Updated 07/09/2023, 06:31 AM

For the past couple of weeks, the Russell 2000 iShares Russell 2000 ETF (NYSE:IWM) has been a major focus for traders and investors that have been cautious given the struggle IWM has gone through in its current trading range.

As of yesterday, it has cleared its pivotal 50-day moving average at $221.96 and looks to confirm a bullish phase with a second close over the MA on Thursday.
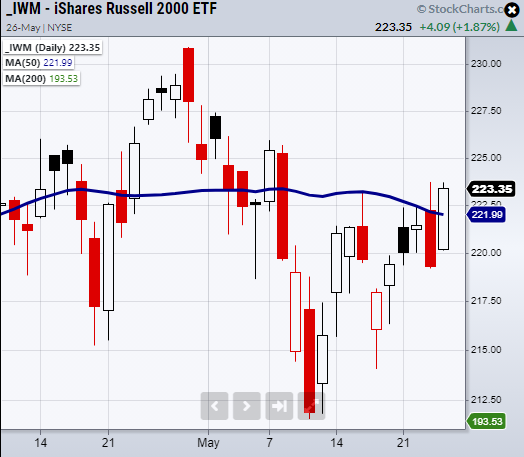
IWM Daily Chart

Additionally, IWM has been a key indicator for bullish market sentiment even though the price action has been choppy.

If IWM confirms its phase change, each major index will be in a bullish phase. At that point, the market can gear up for new highs.

Thursday morning, two economic reports-Jobless Claims and Durable Goods, could set the stage for the rest of the week.

Durable Goods will give insight into the current U.S supply chain which has gone through issues including shortages of semiconductors, to building supplies as the housing market made leaps and bounds with cheap mortgage rates along with increasing demand as people spread out to new states throughout the pandemic.

Circling back, the economic reports could bring negative news based on increasing inflation and missed expectations.

With that said, the market has great potential to make a strong move higher if today's reports come out positive now that IWM's restraints have been cut by clearing the 50-DMA.

ETF Summary

  • S&P 500 (SPYResistance at 422.82.
  • Russell 2000 (IWM) Watching for a second close over the 50-DMA at 221.99.
  • Dow (DIA) Needs to clear 345 and hold.
  • NASDAQ (QQQ) Next resistance at 336.65.
  • KRE (Regional Banks) 68.16 support.
  • SMH (Semiconductors) 242.39 needs to hold as new support.
  • IYT (Transportation) 267.44 support.
  • {{6381|IBB} (Biotechnology) 147 support. Held the 10-DMA at 149.95.
  • XRT (Retail) Filled the gap at 93.52.
  • Volatility Index (VXXBroke support.
  • Junk Bonds (JNKResistance 109.17 108.67 support.
  • XLU (Utilities) Doji day. 65.18 support the 50-DMA.
  • SLV (Silver) 25.23 support.
  • VBK (Small Cap Growth ETF) 276.75 resistance.
  • UGA (US Gas Fund) 34.68 resistance area.
  • TLT (iShares 20+ Year Treasuries) 140.60 resistance.
  • USD (Dollar) Closed over the 10-DMA at 89.99.
  • MJ (Alternative Harvest ETF) 21.40 resistance.
  • LIT (Lithium) 64.25 resistance.
  • XOP (Oil and Gas Exploration) Needs to hold over 85.69.
  • DBA (Agriculture) 18.17 support.
  • GLD (Gold Trust) Minor support the 10-DMA at 175.27.
3rd party Ad. Not an offer or recommendation by Investing.com. See disclosure here or remove ads .

Latest comments

Algo mania madness. Big boys know not to buy, but to play short squeeze psych out games, heat, take profit, dump and repeat. Will move on to other tricks soon. Banks and institutions looking to rob the retailers then flee.
Risk Disclosure: Trading in financial instruments and/or cryptocurrencies involves high risks including the risk of losing some, or all, of your investment amount, and may not be suitable for all investors. Prices of cryptocurrencies are extremely volatile and may be affected by external factors such as financial, regulatory or political events. Trading on margin increases the financial risks.
Before deciding to trade in financial instrument or cryptocurrencies you should be fully informed of the risks and costs associated with trading the financial markets, carefully consider your investment objectives, level of experience, and risk appetite, and seek professional advice where needed.
Fusion Media would like to remind you that the data contained in this website is not necessarily real-time nor accurate. The data and prices on the website are not necessarily provided by any market or exchange, but may be provided by market makers, and so prices may not be accurate and may differ from the actual price at any given market, meaning prices are indicative and not appropriate for trading purposes. Fusion Media and any provider of the data contained in this website will not accept liability for any loss or damage as a result of your trading, or your reliance on the information contained within this website.
It is prohibited to use, store, reproduce, display, modify, transmit or distribute the data contained in this website without the explicit prior written permission of Fusion Media and/or the data provider. All intellectual property rights are reserved by the providers and/or the exchange providing the data contained in this website.
Fusion Media may be compensated by the advertisers that appear on the website, based on your interaction with the advertisements or advertisers.
© 2007-2024 - Fusion Media Limited. All Rights Reserved.