With the news today from the US Fed and the rate hike, we should all be asking ourselves “where are we in the market cycle” so that we can prepare for and identify proper trades that may set up in our future. One thing is for sure; we are not in the perpetual easing environment of the past 7+ years. The Fed indicated they are expecting at least two more rate increases are expected this year and also hinted that a forth may be possible depending on the economic activity.
Our research team at www.TheTechnicalTraders.com is always trying to identify trends and opportunities before they happen for our members and partners. We have a pretty good track record at calling the markets for 2018 and have called many of the markets moves weeks in advance. Please review some of our recent market research to see for yourself how well we’ve been picking apart this market. Today, we are going to illustrate where we believe the US markets are in relation to a typical market cycle and what we should be watching for in our immediate future.
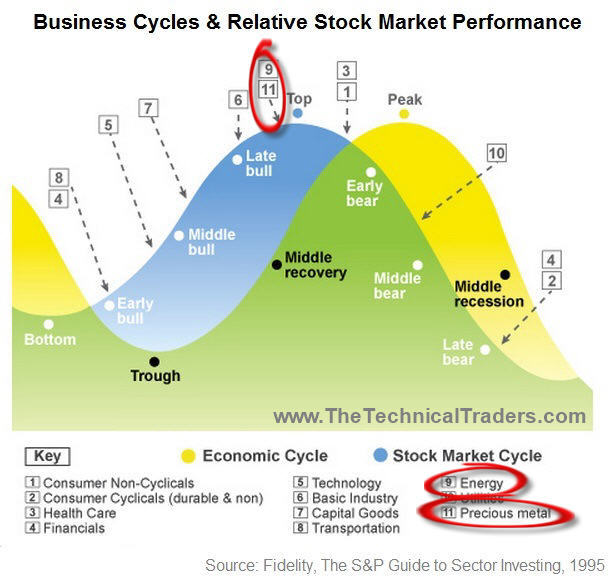
A typical market cycle can often be identified by watching two components of the economy: the Bonds and Commodity prices. When Commodities rise and Bonds fall, the market cycle is considered middle to late stage expansion and traders should be playing any continue bullish price moves as late-stage opportunities in a bullish trend. When Commodities fall and Bonds rise, the market cycle is considered middle to late stage contraction and traders should be playing early bottom picking trades as well as late stage bearish trend trades.

One can see from this simple Economic Cycle that Market Tops are typically preceded by moves in Commodities and Bonds.
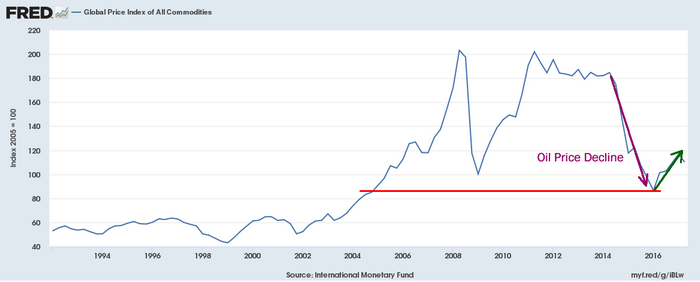
When we look at the global commodity price valuations going back many years, we will quickly see that commodities have recently been historically low and this could result in a dramatic increase in commodities in the future which would be one of the primary signs of late stage expansion. The expansion in global commodity prices rotated lower in late 2014 as oil fell to recent lows and as the global central banks eased off the quantitative easing and money printing. Recently, just before the US elections in 2016, the global commodity price index reached the lowest level since 2004-05 and started climbing higher.

Therefore, we have already begun to experience one of the key components of a market cycle top – rising commodity prices. We would watch for Bonds to decrease as well as Capital Goods, Basic Materials and Energy sectors to rotate out of a historical price channel.
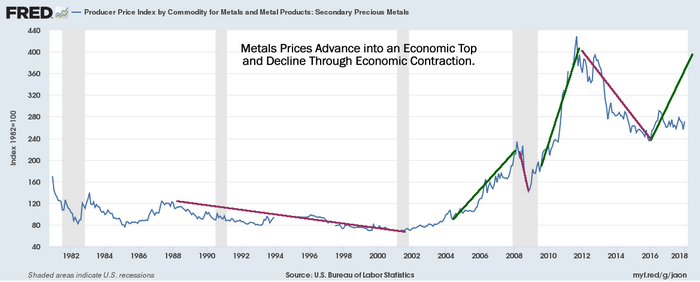
Of unique interest is that late stage economic rallies are often identified by a rally in the precious metals markets as fear of a top or of late stage corrections become more pronounced. Over the past few months, we’ve been warning of a potential Wave 3 leg higher in both Silver and Gold. Many people may not understand the scope of this potential move and the potential it may have on your trading. The size of this move could be substantial. The last rally in the metals that originated after the prior to the 2009 market crash resulted in a price advance from roughly 78 to nearly 435 – a 557% increase in just under 7 years.
What would a similar move in the metals look like today? Could it happen? Would it be as dramatic?

Gold closed $1332.50 today. A 250% increase would put gold at $3331.25. A 350% increase would put gold at $4663.75. A 450% increase would put gold at $5996.25. So, is a $6000 price for Gold reasonable? Possibly, give certain market setups that prompt a similar price advance as we had seen after 2002. It would all depend on how this new market top unfolds and the level of fear that resides in the global markets.
The last precious metals signaled a trade was in February we profited 20% in only 7 days profiting from falling prices. The next trade setup could be much larger.
As the US fed pushes rates higher, more and more consumers will be pushed to their financial limit that will drive some level of economic contraction. It is almost like the US fed has no understanding of supply and demand functions as related to their policies. As they push the rates higher trying to front-run inflationary concerns, they don’t understand that many borrowers can’t sustain raising rates at this pace. In the process, many borrowers will be pushed into foreclosure and possibly bankruptcy as the fed attempts to normalize rate levels.
As traders, our job is to find the opportunity that exists and to try to capitalize on price movements and from swings in valuations that occur throughout this game. The US fed and global central banks will do what they do – we really don’t have any control over them or their decisions. As traders, our job is to be ahead of these central banks and take advantage of the opportunities they provide to us.
