Today’s Fed meeting is of critical importance, not only for what it says about any change in interest rates, but also for what it signals about the path ahead.
U.S policy makers are expected to hike +25bps for the second time in a decade at 02:00pm EST, motivated by their economy’s progress towards full employment (+4.6% unemployment) and the Fed’s inflation objectives converging towards +2%.
Nevertheless, it’s the “forward guidance” that will dictate the next leg of asset price moves.
Investors can expect Fed Chair Yellen to keep open the possibility of multiple hikes in 2017, supported by a solid economic baseline stateside, but also by the new upside potential for growth and inflation associated with Trumponomics.
The pace of these hikes remains a huge unknown, dependent on the so-called promised infrastructure spending by the new President-elect.
For now, investors should expect the FOMC’s “dot plot” to remain relatively unchanged and the forward guidance again to be data dependent, at least until the market gets more details on Trump’s economic policies.
The Fed cannot be perceived as being too aggressive. Why? They cannot afford to move prematurely. If that is the case, maybe the dollar will come under some pressure at least until the turn.
Note: There is a plethora of interest rate decision over next two days, aside from the Fed there is SNB, BoE, Norges and Banxico on Thursday and Russia on Friday.
1. Global equities seek assurances from the Fed
In Asia, regional indexes naturally showed little clear direction overnight ahead of today’s Fed announcement.
Already this week, Asian stock prices moves have been playing catch up with stateside bourses as investors seek Fed assurances before moving on due to the many surprises events that have already happened this year (Brexit, Trump, etc.).
Korea’s Kospi closed up +0.04%, Australia’s ASX 200 gained +0.7% and Hong Kong’s Hang Seng Index climbed +0.04%. Taiwan’s Taiex slipped -0.1%. In Japan, the Nikkei closed flat, as traders processed the BoJ’s quarterly tankan survey (see below).
In Europe, equity indices are trading lower ahead of a plethora of U.S earnings and the FOMC meeting. Financials are trading mixed on the Stoxx600 while commodity and mining stocks are generally lower on the FTSE 100.
In the U.S, the Dow Jones continues its charge towards 20,000, printing another all time high yesterday along with the S&P 500. Futures are set to open up little changed.
Indices: Stoxx50 -0.4% at 3,225, FTSE -0.2% at 6,953, DAX -0.2% at 11,264, CAC 40 -0.4% at 4,783, IBEX 35 -0.7% at 9,266, FTSE MIB flat at 18,823, SMI -0.3% at 8,138, S&P 500 Futures flat

2. Crude prices remain contained for now, gold flat
Oil prices fell overnight following yesterday’s weekly inventory data that reported a rise in U.S. crude stocks (API: +4.7M vs. -2.2M prior; first build in four-weeks and the largest since Nov 1) and an estimate that OPEC may have produced more crude in November than previously thought.
Brent crude futures are trading down -60c, or -1.08% at +$55.12 a barrel. Light crude or WTI oil futures are down -69c, or -1.3% to +$52.29 a barrel.
A report from the IEA indicates that they believe that OPEC pumped about +34.2m bpd of crude in Nov – that’s +500k above OPEC’s official estimate, which was already a record. If true, this will undermines all the recent efforts by OPEC and its non-members to cut production.
Earlier this week the IEA indicated that global oil markets would move into a supply deficit in H1, 2017 as OPEC and non-OPEC producers cut production. The problem with this theory is that elevated price levels will only encourage an uptick in shale production and other off U.S production rigs to come back on line.
With the FOMC continuing to dominate the short-term direction of metals its no surprise to see gold prices were mostly unchanged in the overnight session (+0.4% to $1,162.55) ahead of the Fed rate decision later today.

3. What’s the shape of the U.S yield curve to be?
A rate hike today is priced in. Fixed income dealers will now focus on growth and interest rate forecasts to shape their U.S yield curve.
If the Fed generates any new anxieties over a faster pace of rate increases next year the bond market would sell off and back up yields (U.S. 10-Year notes +2.455%).
But if the Fed again signals, “data depending” without meaningful changes to their rate policy outlook, bond yields may fall and prices rise (+2.35% next support level).
If that’s the case, expect investors to pare back wagers betting on higher yields.
Note: The latest weekly U.S treasury survey indicates that clients are at their most bearish sentiment on bonds in 18-month highs.
Elsewhere,Germany's 10-Year bund yield dropped -2bps to +0.34% while JGB’s 30-Year bond yield slid -7bps to +0.73% as the BoJ stepped up their purchases of longer-term debt.

4. Next dollar move depends on dot plot
The “big” dollar is expected to have a muted response to the Fed’s expected +25bps, but may see more volatile price action in reaction to Chair Yellen’s subsequent press conference.
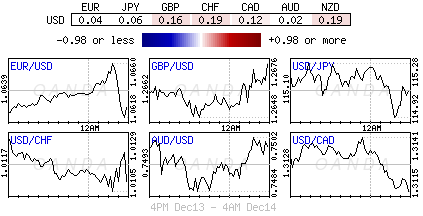
Overnight, the USD has consolidated in quiet trading ahead of the Fed. The EUR saw early gains evaporate with single unit sellers clustered above €1.0660. USD/JPY continues to hover atop of ¥115.00, while the pound (£1.2658) is off its highs after data showed that the U.K labor market softened in Oct.
Fixed income dealers believe the Fed is poised for a ‘dovish rate hike’ while signaling they are in no rush to hike rates further from here. This should take some of the rate premium froth off the dollar.
However, there are some analysts who are concerned over increasing signs of a USD shortage in “offshore” markets, which could spark a rapid USD rally going into next-year.

5. Japan’s Tankan report
With manufacturing playing a critical role in the Japanese economy, the Tankan survey is considered the best gauge of the industry’s health due to its large sample size and respected source.
Overnight, the manufacturing and non-manufacturing survey’s produced some strong results.
The survey showed that sentiment between large manufacturers rose to +10 in Q4 from +6 in Q3 i.e business conditions are favourable.
The answer lies with Trump’s election win. It has been a massive advantage for Japan’s manufacturers. The yen has fallen more than -10% outright (¥115.02) on expectations for Trump’s economic policies.
The report also revealed that Japanese companies were cautious about their capital-expenditure plans (CAPEX). Despite the BoJ usually paying close attention to CAPEX, the main headline print should push the BoJ to the sidelines for the time being.