
Let's continue to explore the past 20 years of Fed actions. I believe the Fed has created a global expansion of both economies and debts/liabilities that may become somewhat painful for foreign nations – and possibly the U.S.
Reading Data And What To Expect In 2022 And Beyond
In the first part of this research article, I highlighted the past 25 years of Fed actions related to the dot-com bubble, the 9/11 terrorist attack, the 2008-09 U.S. housing/credit crisis and the recent COVID-19 virus event. Each time, the Federal Reserve had attempted to raise interest rates before these crisis events – only to be forced to lower interest rates as the U.S. economy contracted with each unique disruption. The Fed was taking what it believed were necessary steps to protect the U.S. economy and support the global economy into a recovery period.
The following few charts highlight the results of the Fed's actions to keep interest rates extremely low for most of the past 20 years. I want to highlight what I believe is an excessive credit/debt growth process that has taken place throughout most of the developing world (China, Asia, Africa, Europe, South America and other nations). At the same time, the U.S. has struggled to regain a functioning growth-based economy absent of Federal Reserve zero-interest policies and stimulus.
Extreme Growth Of World Debt (Excluding U.S.)
This Rest Of The World; Debt Securities and Loans, Liabilities chart highlights the extreme, almost parabolic, growth in debt and liabilities that have accumulated since 2005-06. If you look closely at this chart, the real increase in debt and leverage related to global growth started to trend higher in 2004-05. During this time, the U.S. housing market was on fire, which likely pushed foreign investors and foreign housing markets to take advantage of this growing trend in U.S. and foreign real estate. This rally in speculative investments, infrastructure and personal/corporate debt created a huge liability issue throughout many developing nations. Personal and corporate debt levels are at their highest levels in decades. A recent Reuters article suggests global debt levels have risen in tandem with real estate price levels and is closing in on $300 trillion in total debt.
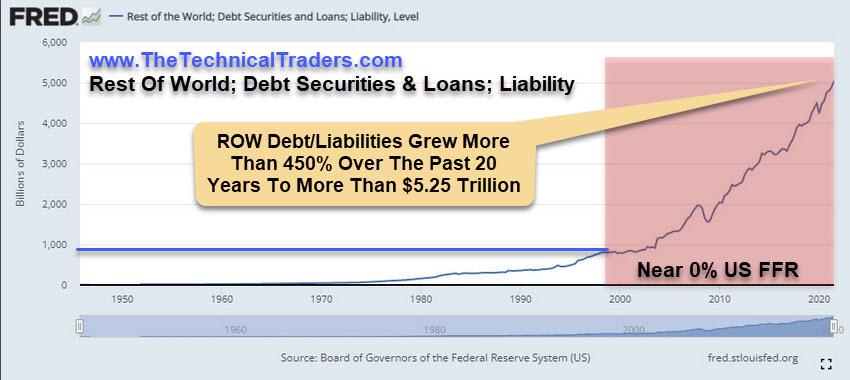
(Source: fred.stlouisfed.org)
GDP Implicit Price Deflator Rallies To Levels Not Seen Since 1982-83
The rally in the U.S. markets and the incredible rise of inflation over the past 24 months have moved the consumer price levels higher faster than anything we've seen over the past 50+ years. We've only seen price levels rise at this pace in the 1970s and the early 1980s. These periods reflected a stagflation-like economic period, shortly after the Fed ended the Gold Standard. This was also a time when the Federal Reserve moved the Fed Funds Rate up into the 12% to 16% range to combat inflationary trends.
If the GDP Implicit Price Deflator moves above 5.5% over the next few months, the Fed may be forced to take stronger action to combat these pricing issues and inflationary trends. It has to be cautious not to burst the growth phase of the markets in the process – which could lead to a very large deflationary/deleveraging price trend.

(Source: fred.stlouisfed.org)
We need to focus on how the markets are reacting to these extreme debt/liability trends and extreme price trends. The markets have a natural way of addressing imbalances in supply/demand/pricing functions. The COVID-19 virus event certainly amplified many of these issues throughout the globe by disrupting labor, supply, shipping and manufacturing for a little more than 12+ months.
The future decisions of the Federal Reserve will either lead to a much more orderly deleveraging/devaluation process for the U.S. and global markets – supporting the natural economic functions that help to process and remove these excesses. Or, the Federal Reserve will push interest rates too high, too fast, and topple the fragile balance that is struggling to process the excesses throughout the global markets.
What Does This Mean?
I believe this data, and all the charts I've shared with you in this research article, suggest the Fed is trapped in a very strenuous position right now. I'll share more information with you regarding my predictions for December 2021 and 2022 in the third part of this article.
I will also share my proprietary Fed Rate Modelling System's results in Part 3 of this article, and tell you what I expect from the Federal Reserve and U.S. stock markets.