
Last but not least is NVIDIA (NASDAQ:NVDA). This will complete my mini-series review of the seven most important stocks of the current market (Facebook (NASDAQ:FB), Apple (NASDAQ:AAPL), Netflix (NASDAQ:NFLX), Alphabet (NASDAQ:GOOGL), Microsoft (NASDAQ:MSFT), Amazon.com (NASDAQ:AMZN) and Nvidia), using Elliott Wave Theory (EWT) and technical analysis. After this review, I will write a synthesis of my findings:
You can find the six previous reviews here:
Apple
Microsoft
Amazon
Alphabet
Facebook
Netflix
NVIDIA Corp. sits at a substantial market cap of $258.5 billion, which is slightly more than Netflix’s at $223.0 billion. I should have reviewed Netflix last, given I did all prior reviews on descending market cap, but since Nvidia is a chipmaker, it is the odd duck, so to say.
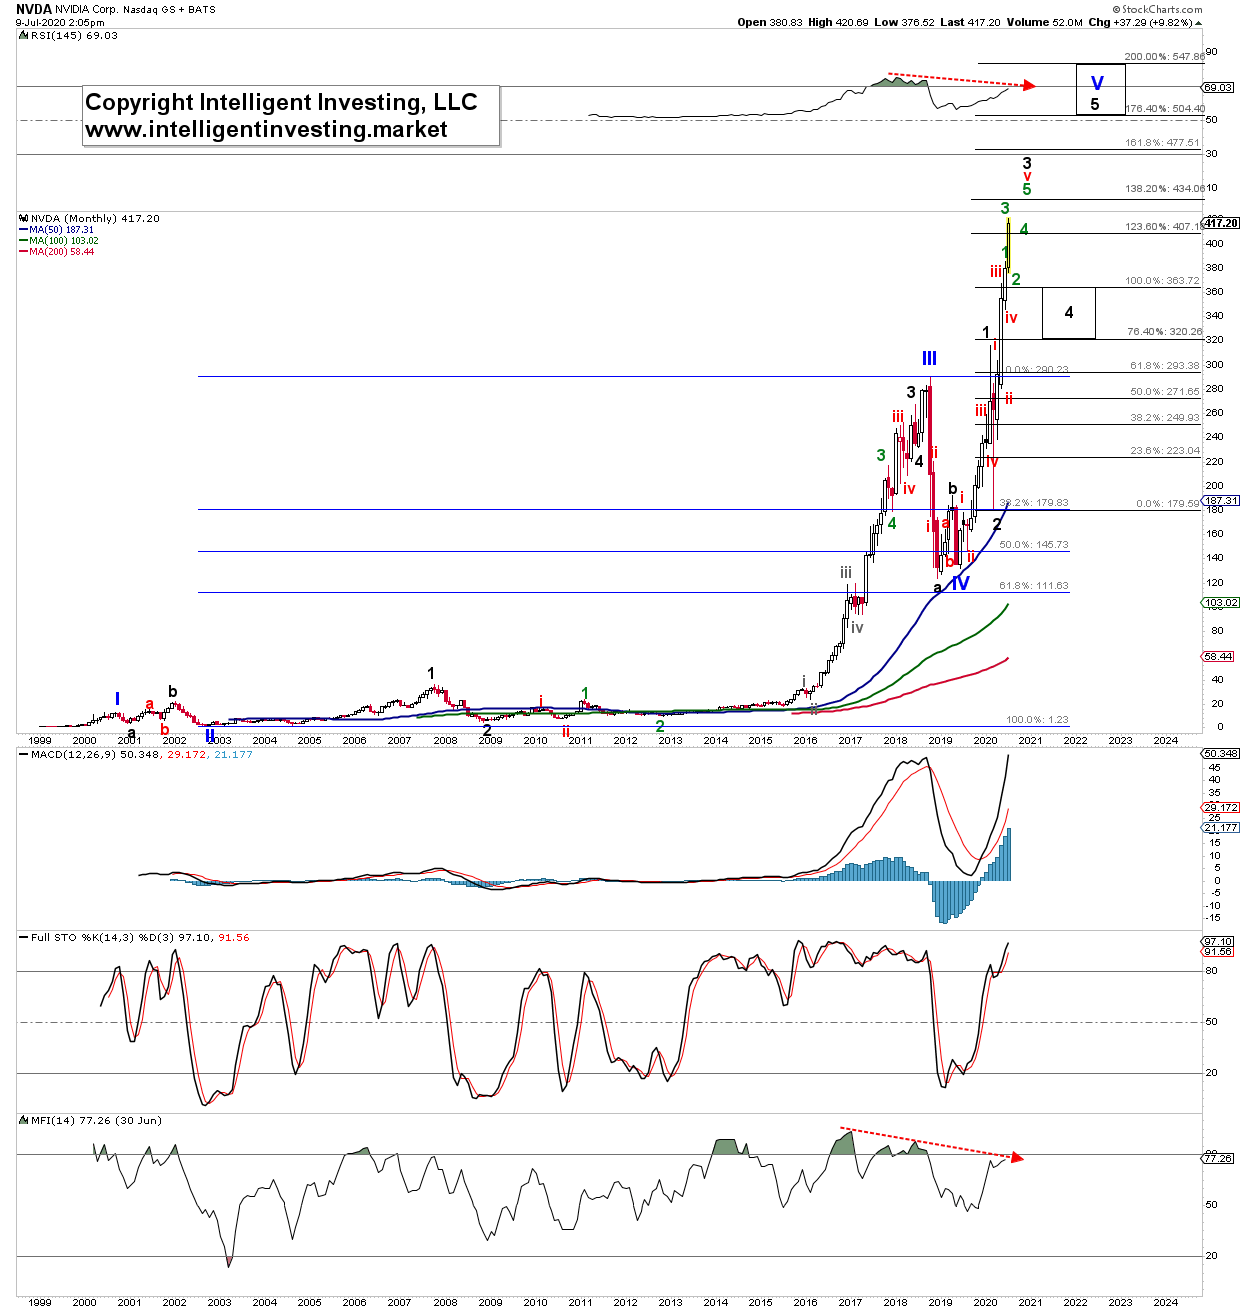
As usual, I would like to start with the monthly chart, so we can get a good idea of where it is in the big picture. See Figure 1 below.
Using EWT, I count the low in 2002 as (blue) Primary-II and the high and low in 2007, 2008, respectively, as (black) major-1, 2 of Primary-III. The latter topped, according to my work, early 2018. Nvidia’s stock went then in a significant correction: Primary-IV. It should now be in Primary-V. As you can see, the stock has a few more waves to wrap up before it is all said and done. I anticipate a more significant pullback soon (wave-4) and then a last rally to the low-500s for wave-5. Like all other stocks I have reviewed, the Money Flow Index (MFI) is once again lagging: less money is flowing into this stock at these elevated prices. When liquidity dries up, it means there are fewer buyers.
Figure 1
More detail can is provided in my daily chart for Nvidia’s stock. Many will always argue against Elliott wave and its forecasting power-based mainly on opinions. So let’s review some details. Black major-1 was five waves up. Once five waves are complete, a correction unfolds. Always. In this case, it was major-2. Corrections are most often three-waves or additives of that number. In this case, major-2 consisted of three smaller waves: (red) intermediate waves a, b, and c. The c-wave was almost exactly 1.382x the length of wave-a, and wave-2 in addition to that practically retraced 76.40% of wave-1. Both are picture-perfect Fibonacci ratios. Nvidia then went on to rally, and IMHO wave-3 of iii of 3 tagged almost precisely the 100% extension of (red) wave-i, measured from (red) wave-ii. All textbook so far.
Thus, when we look back, we see nothing but price adhering almost entirely to Fibonacci-based price levels for each corresponding wave. Hence, if the past behaved as it did, why then should the future be any different? Please cast opinions aside and let the chart do the talking. When this stock completes its five primary waves up, it will see a big fat hair cut. But, the Elliott wave count shows Nvidia is not ready just yet to go to the barbershop.
The company’s stock should now be in its last move higher to ideally the $430-434 target zone. That is where the 200% extension of wave-i and the 138.20% extension of wave-1 coincide. The former is a classic 5th wave target (red wave-v in this case), while the latter is a common 3 rd wave target (black wave-3 in this case). From there, I expect a decent retrace down to the $365-320 zone for a flat-type wave-4
correction. From that target zone, the stock’s price can then launch to the previously mentioned low-$500s for its final wave-5 of V. Only then has its hair grown long enough to warrant a buzz cut.
Figure 2.
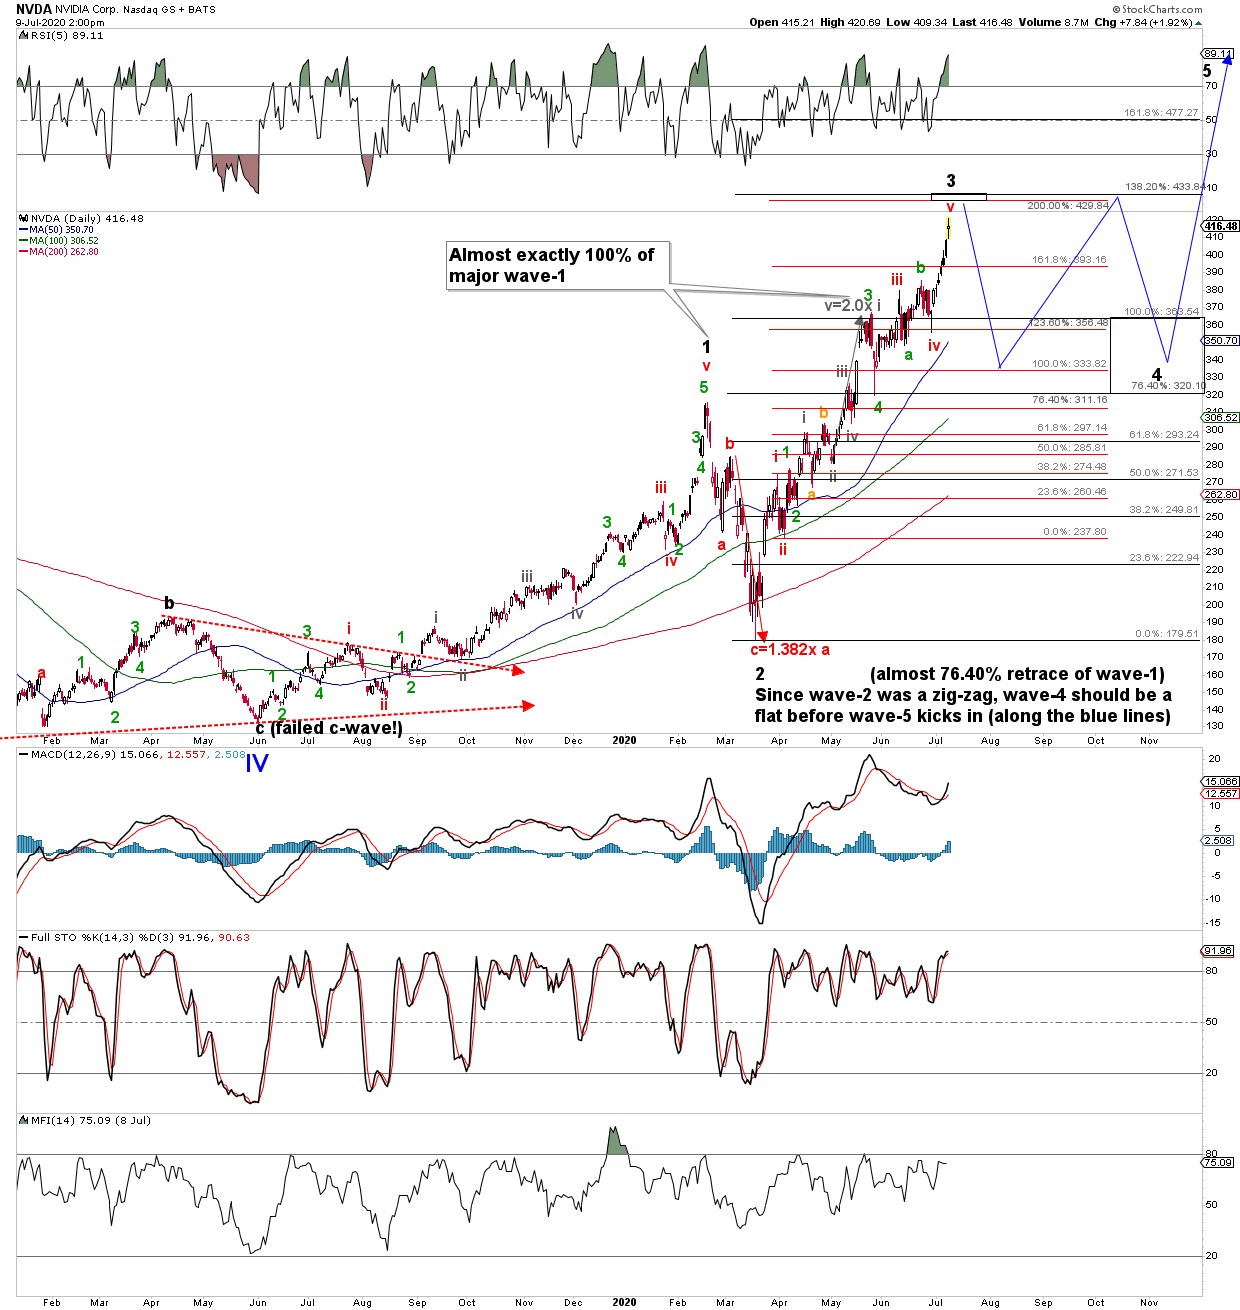
The bottom line is, I expect a little more upside for Nvidia short term before it rolls over and starts a decent decline (~25 +/- 5%) lasting several weeks. This decline will ideally be overlapping. Think a flat type correction as shown or even a (horrible) triangle. From that pending low, it should then stage a last multi-month rally gaining around 60 +/- 5%. Once that rally completes, Nvidia, like Netflix shown in yesterday’s update, will ideally complete five larger Primary waves up since its IPO in 1999 and should see one of its largest haircuts. Think a move back to $150 +/- 50. Once again, this may sound crazy, and time will tell.
Still, given how well Nvidia is currently adhering to the Elliott waves and associated Fibonacci extensions and retraces, I can only accept it will do so in the future too once it completes five primary waves up. As usual, please know your time frame when trading and investing in Nvidia over the next few days, weeks, months and years.