Get 40% Off
⚠ Earnings Alert! Which stocks are poised to surge?
See the stocks on our ProPicks radar. These strategies gained 19.7% year-to-date.
Unlock full list

Falling Earnings Estimates Signal Weakness Ahead For Ferroglobe (GSM)

Published 09/30/2019, 08:55 AM
Updated 07/09/2023, 06:31 AM

Similar to wise buying decisions, exiting certain underperformers at the right time helps maximize portfolio returns. Selling off losers can be difficult, but if both the share price and estimates are falling, it could be time to get rid of the security before more losses hit your portfolio.

One such stock that you may want to consider dropping is Ferroglobe PLC (NASDAQ:GSM) , which has witnessed a significant price decline in the past four weeks, and it has seen negative earnings estimate revisions for the current quarter and the current year. A Zacks Rank #4 (Sell) further confirms weakness in GSM.

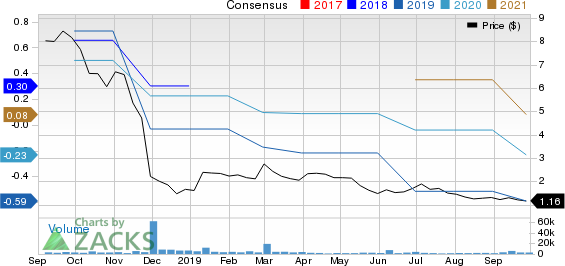
A key reason for this move has been the negative trend in earnings estimate revisions. For the full year, we have seen four estimates moving down in the past 30 days, compared with no upward revisions. This trend has caused the consensus estimate to trend lower, going from a loss of 52 cents a share a month ago to its current level of a loss of 59 cents.

The stock also has seen some pretty dismal trading lately, as the share price has dropped 12.1% in the past month.

So it may not be a good decision to keep this stock in your portfolio anymore, at least if you don’t have a long time horizon to wait.

Ferroglobe PLC Price and Consensus

If you are still interested in the Chemical - Specialty industry, you may instead consider a better-ranked stock - American Vanguard Corporation (NYSE:AVD) . The stock currently holds a Zacks Rank #2 (Buy) and may be a better selection at this time. You can see the complete list of today’s Zacks #1 Rank (Strong Buy) stocks here.

Today's Best Stocks from Zacks

Would you like to see the updated picks from our best market-beating strategies? From 2017 through 2018, while the S&P 500 gained +15.8%, five of our screens returned +38.0%, +61.3%, +61.6%, +68.1%, and +98.3%.

This outperformance has not just been a recent phenomenon. From 2000 – 2018, while the S&P averaged +4.8% per year, our top strategies averaged up to +56.2% per year.

See their latest picks free >>


American Vanguard Corporation (AVD): Free Stock Analysis Report

Ferroglobe PLC (GSM): Free Stock Analysis Report

Original post

Zacks Investment Research

Latest comments

Risk Disclosure: Trading in financial instruments and/or cryptocurrencies involves high risks including the risk of losing some, or all, of your investment amount, and may not be suitable for all investors. Prices of cryptocurrencies are extremely volatile and may be affected by external factors such as financial, regulatory or political events. Trading on margin increases the financial risks.
Before deciding to trade in financial instrument or cryptocurrencies you should be fully informed of the risks and costs associated with trading the financial markets, carefully consider your investment objectives, level of experience, and risk appetite, and seek professional advice where needed.
Fusion Media would like to remind you that the data contained in this website is not necessarily real-time nor accurate. The data and prices on the website are not necessarily provided by any market or exchange, but may be provided by market makers, and so prices may not be accurate and may differ from the actual price at any given market, meaning prices are indicative and not appropriate for trading purposes. Fusion Media and any provider of the data contained in this website will not accept liability for any loss or damage as a result of your trading, or your reliance on the information contained within this website.
It is prohibited to use, store, reproduce, display, modify, transmit or distribute the data contained in this website without the explicit prior written permission of Fusion Media and/or the data provider. All intellectual property rights are reserved by the providers and/or the exchange providing the data contained in this website.
Fusion Media may be compensated by the advertisers that appear on the website, based on your interaction with the advertisements or advertisers.
© 2007-2024 - Fusion Media Limited. All Rights Reserved.