
Company Description
Facebook Inc (NASDAQ:FB). is focused on building products that enable people to connect and share through mobile devices, personal computers and other surfaces. The Company's products include Facebook, Instagram, Messenger, WhatsApp and Oculus.
Discounted Cash Flow (DCF)
The DCF valuation of Facebook will be based on a model I created. For reasons of space, I will not explain in detail the calculation of each input of the model.
Starting data of the model:
In the image is shown the screen of the model where all the accounting data are collected, and not, of the company. (data in billions of dollars)

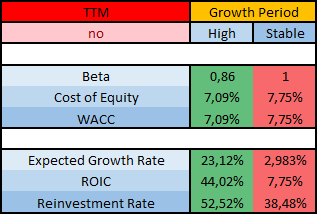
STEP 1: Discount rates (updated data to 05/24/2018)

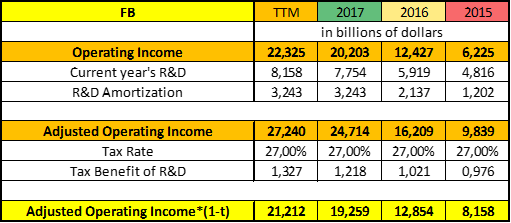
STEP 2: Adjusted EBIT*(1-t) (adjusted for capitalization of research and development costs)
STEP 3: Reinvestment rate and Free Cash Flow To The Firm (FCFF)
The average reinvestment rate of the last 3 years is used to determine the FCFF.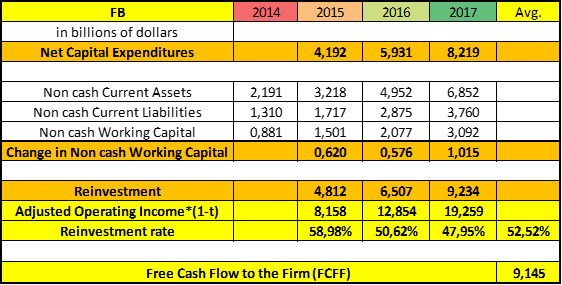
STEP 4: EBIT after taxes growth rate
The growth rate is determined as the company reinvests (reinvestment rate) and the quality of reinvestments (ROIC). (assuming that ROIC remains stable over the next few years)

STEP 5: Two Stage Growth Model (high growth (5 years) + stable growth)
When an enterprise moves from a phase of high growth to a stable growth phase, it is necessary to attribute to it the characteristics of mature enterprises with stable growth:
- -Cost of equity.The beta is taken from the value of 0,86 to 1.
- -Excess returns. We hypothesize a lack of excess returns during the stable growth phase, thus setting the return on invested capital (ROIC) at a value equal to that of the cost of capital (WACC).
- -Reinvestment rate. Businesses in a stable growth phase tend to reinvest less than those in the high growth phase, so we can express the reinvestment rate, in the stable growth phase, as the ratio between the stable growth rate and the ROIC that the company can support in the phase of stable growth.
- -Stable growth rate. Since no company can grow to infinity at a rate higher than the general growth rate of the economy, we establish the perpetual growth rate in the phase of stable growth equal to risk-free rate of 2,983%.

STEP 6: Equity value
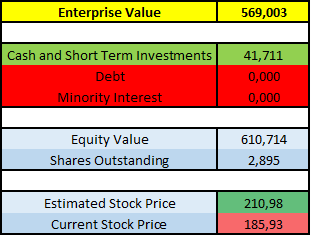
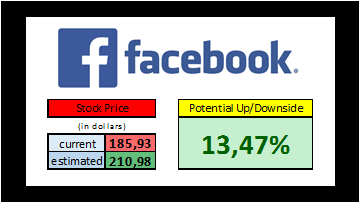
CONCLUSIONS:
Facebook shows a 13,47% potential, starting from the closing price of 05/24/2018.
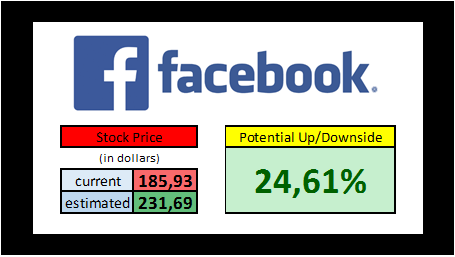
EXTRA:
Facebook has closed the fiscal year 2017 in the month of December. Therefore, for these calculations, "old" data of six months were used. Making some hypotheses, it is possible to repeat the procedure to take into account the past three months (one quarter), using the EBIT TTM (sum of the last four quarters) net of taxes.
DATA:
We use the estimates made previously relating to the WACC, reinvestment rate, ROIC and expected growth rate of EBIT after tax.
Adjusted EBIT*(1-t) it was calculated in the second image.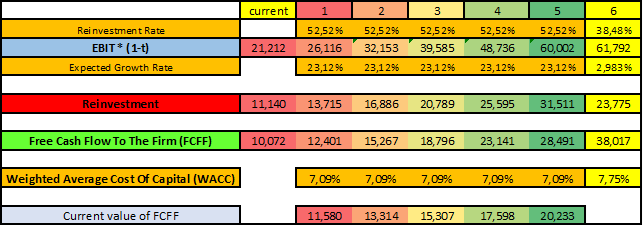
Disclosure: The information contained in this article represents my personal analysis / opinion and does not contain a recommendation for an investment or a particular stock.