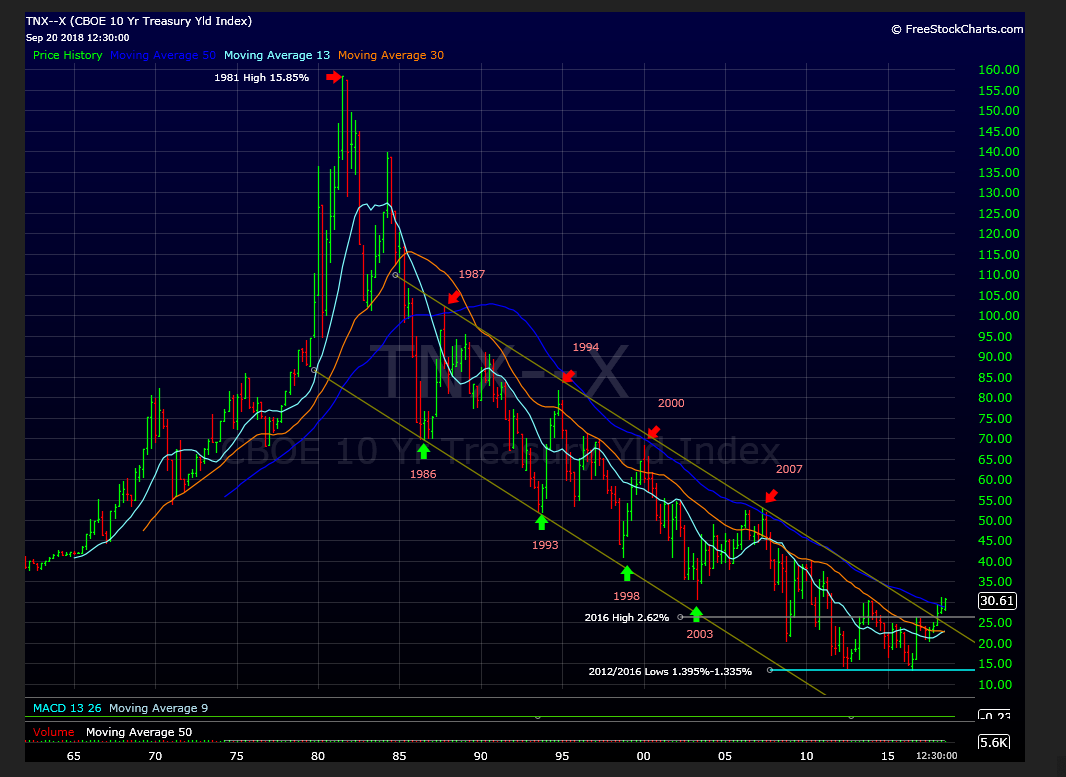
The above chart was provided by Gary Morrow, a solid technician who writes with a few other guys at “This Week on Wall Street” (http://thisweekonwallstreet.com/).
The significance of the above chart will be addressed shortly.
The 10-year Treasury yield resistance is the point where the yield has been turned back/rejected on the chart several times:
- 5/17/18: 10-year yield peaked at 3.11% – 3.12%
- Early Jan ’13: 10-year Treasury yield peaked at 3.04%
- Early Sept ’13: 10-year Treasury yield peaked at 2.985%
Each print in this area represented a point where it paid to get long the TLT and sit on it for a while.
Does the past repeat again ?
In the opening chart, Gary Morrow notes that the TNX (CBOE 10-year Treasury yield contract) is headed for its first close above its “50-quarter” moving average since September, 1985.
The iShares 20+ Year Treasury Bond (NASDAQ:TLT) is now bumping along its 2017 and 2018 lows again.
Summary / conclusion: We’ve been up to this level in the 10-year Treasury yield several times in the last few years, and each time the resistance proved too much and 10-year Treasury and the TLT rallied significantly off these areas. Readers can be patient. Jeff Gundlach is out saying the 30-year Treasury yield needs to close above the 3.26% level twice to be significant. Charlie Bilello of Pension Partners is noting that the bond market (presumably AGG) is heading for its worst two years since 1981.
My own contribution to these formidable authors, bond guru’s and technicians, is that I think the 10-year Treasury could get to 4% just based on the 2% historical “real rate” of return for Treasuries.
The key question always remains – what’s the true rate of inflation ?
With jobless claims set to fall below 200,000 and sitting at 49-year lows, and an unemployment rate poised to drop below 4%, the 10-year Treasury yield could still move significantly higher, depending on wage inflation.
But boy, has it been a frustrating trade, i.e. waiting for higher interest rates.
Readers can be patient and wait for the breakout above 3.12% on the 10-year Treasury yield and above 3.26%, preferably on a weekly or monthly close.
Clients are positioned with a 5% – 10% position in the ProShares Short 20+ Yr Treasury (NYSE:TBF) (inverse, unlevered Treasury ETF), a lot of cash, now earning 2% interest for the first time in 10 years, the JP Morgan Strategic Income Opportunities Fund, and Treasuries bills set to mature within the next year. Relative to the AGG, client bond portfolios have out performed nicely, however that is just making up for the post-2008 period where the bond allocations did not perform well. Duration is screwed down tightly and credit risk is minimal.
This will eventually change.
