The markets are in serious trouble as the extreme oil price volatility continues to devastate the global economy. Investors and analysts today are totally clueless because they have become the frogs burnt to a crisp in the frying pan. Over the past several decades, the oil price has fluctuated tremendously, much like the EKG of an individual whose vital signs have run amok.
Unfortunately, no one seems to notice, and no one seems to care (George Carlin). However, the market and traders have grown accustomed to the volatile trading insanity as the oil price rises and falls 3-5% in a day. Today, the West Texas Intermediate (WTI) Crude oil price has been down more than 4%:
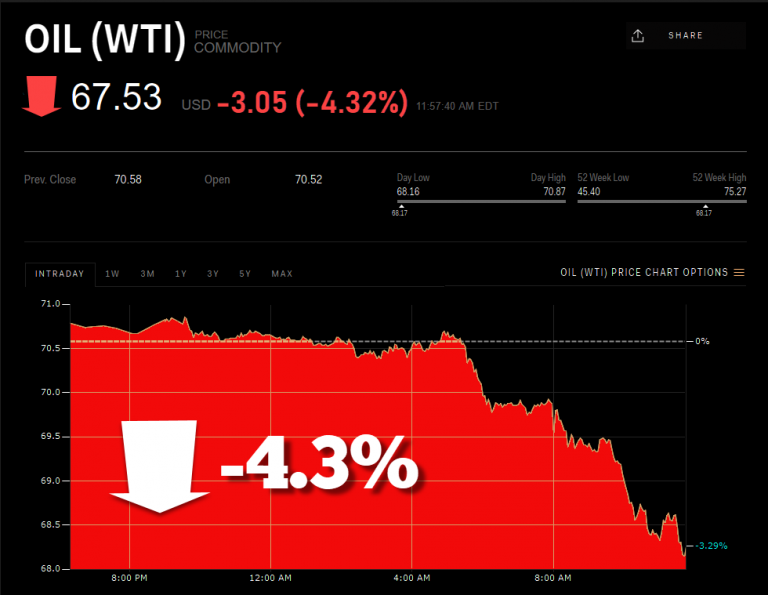
And if we consider that the oil price was trading at $74 just last week, it is now down a further stunning 8%. However, if we look at the oil price over a six-month period, the price fluctuations are even more significant:
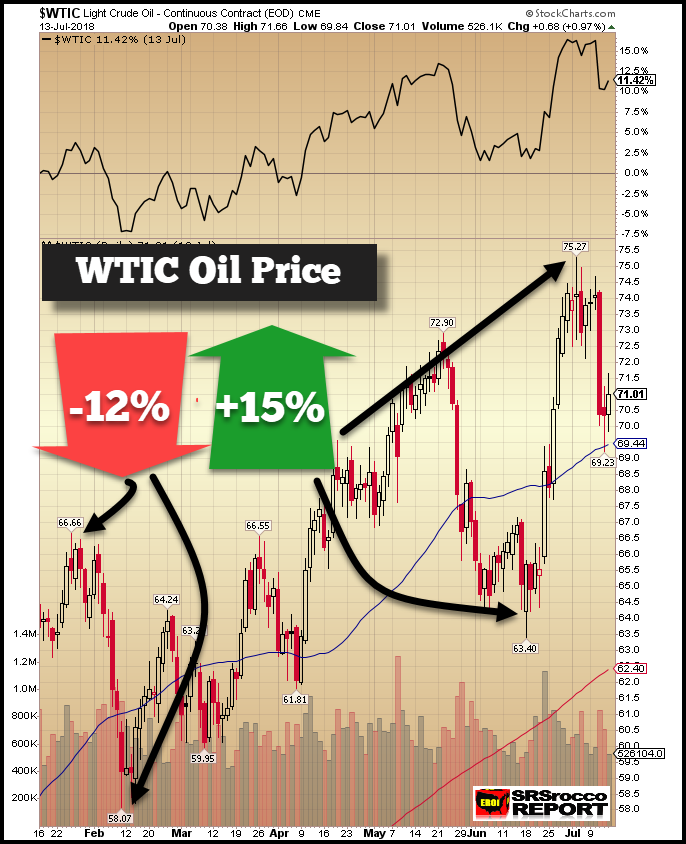
When the stock markets suffered a correction at the end of January, beginning of February, the oil price fell 12% in a matter of a few weeks. And more recently, the oil price shot up 15% from a low of $64 to a closing high of $74. This huge 15% increase took place in the last two weeks of June.
With the world producing and selling 80+ million barrels of oil per day, large oil price fluctuations cause a great deal of stress in the overall markets. According to the study on Oil Price Volatility: Causes, Effects, and Policy Implications:
Sharp, rapid swings in the price of oil can have outsize effects on companies, economies, and global geopolitics. Oil price spikes can stunt economic growth, for example, and a sudden price plunge can wreak havoc on cash-strapped oil companies. For countries, an oil price roller coaster can blow a hole in government budgets, prompt wholesale economic reform, or alter geopolitical priorities seemingly overnight.
Extremely large oil price spikes can stunt economic growth while collapsing prices negatively impact public and national oil companies. However, this hasn’t always been the case. During the twenty years from 1950 to 1970, the volatility of the U.S. oil price was extremely low, and during the latter decade… it was virtually non-existent:
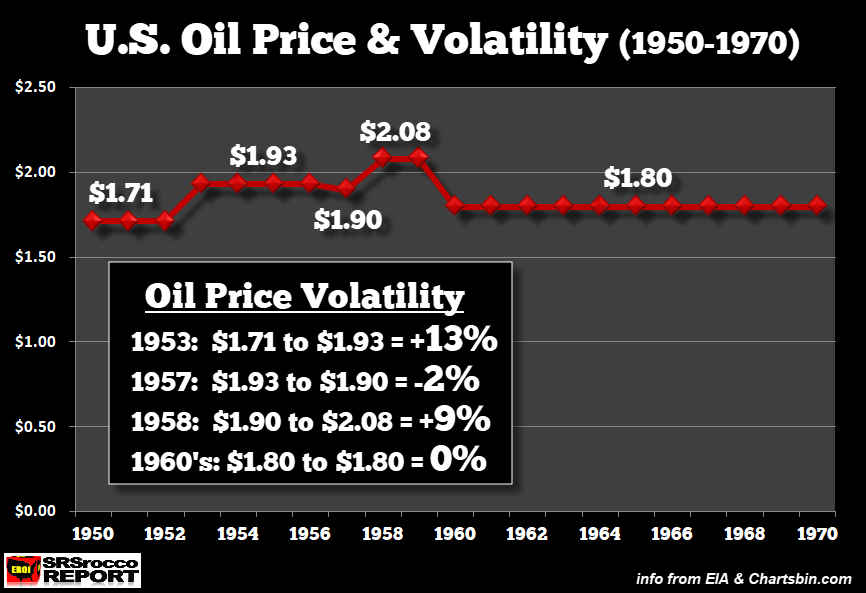
From 1950 to 1953, the U.S. oil price remained at $1.71 a barrel. Then in 1954, it increased by 12% and remained at $1.93 for three years until 1954. The oil price then fell 2% to $1.90 in 1957 before rising 9% to $2.08 for 1958 and 1959. Later on Sept 14th, Iraq, Iran, Saudi Arabia, Kuwait, and Venezuela established OPEC and set the oil price at $1.80 from 1960-1970.
However, when the United States peaked in conventional oil production in 1970 and then after Nixon dropped the Gold-Dollar Peg in 1971, the oil price spiked and the period of tremendous price volatility began:
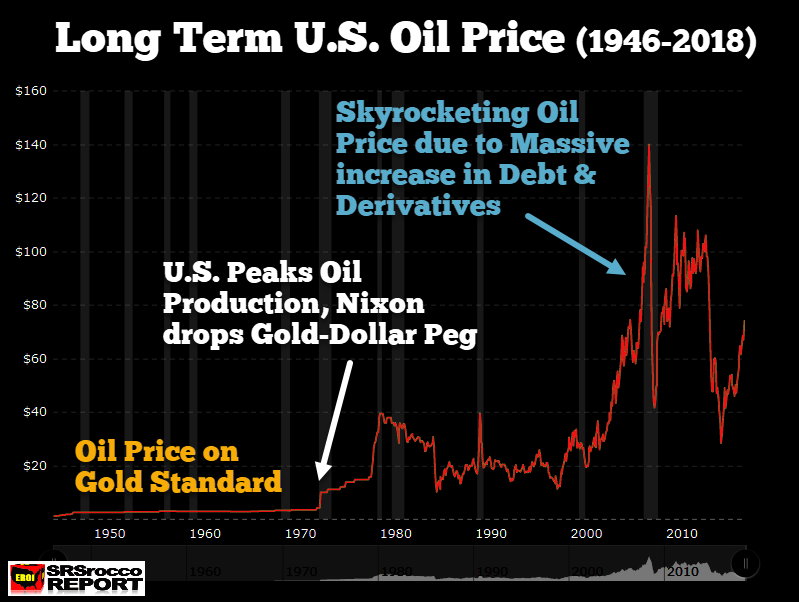
As we can see in the chart above when the world was still on the Gold Standard and awash in low-cost, high-quality oil, the oil price remained remarkably stable. However, after the Dollar-Gold Peg was dropped in 1971, then the oil market changed forever. The oil price shot up from $1.80 in 1970 to $36.83, which was the key factor that pushed the gold price up from $36 to $612 during the same period. As the oil price surged 20 times from 1970 to 1980, the gold price increased 17 times.
Now, if we look at the oil price after 2000, the price volatility has gone completely wild. The oil price jumped from $19 in 1999 to a high of $146 in 2008. While the oil percentage increase (8 times) during the 2000’s wasn’t as tremendous as during the 1970’s (20 times), the volatility is much worse.
For example, the oil price fell from a high of $146 in June 2008 to a low of $34 by the end of the year. In just six months, the oil price fell 77% from its high. As the oil price recovered and then stayed above $100 from 2011-2014, it fell very quickly to $30 by the beginning of 2016.
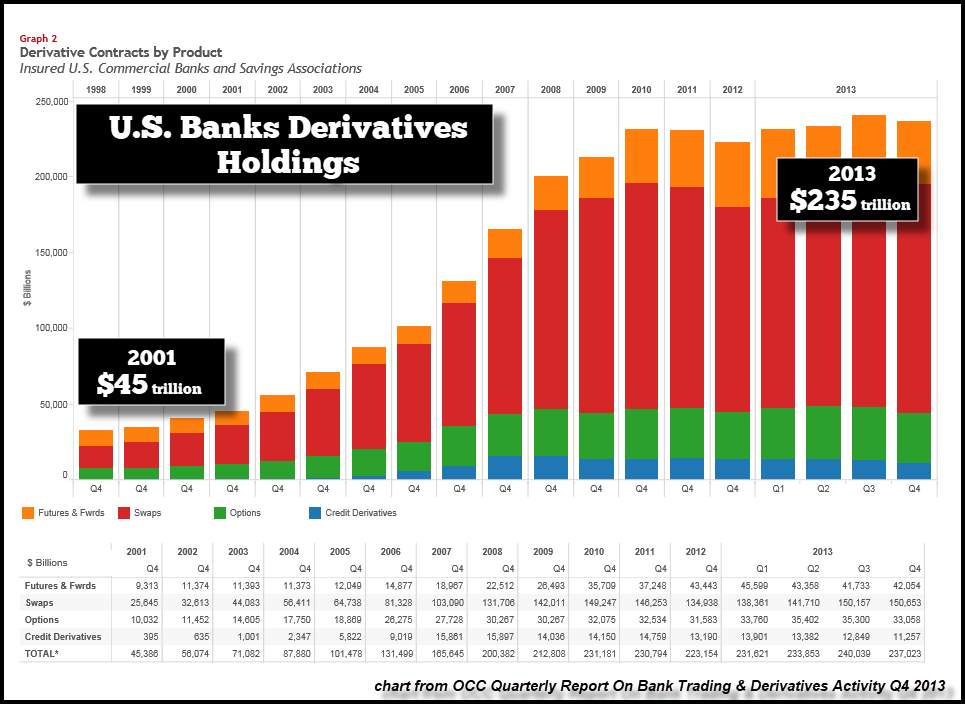
The reason for the significant oil price rise in the 2000’s was due to the massive increase in global debt and derivatives. According to the OCC Quarterly Reports on Bank Trading and Derivatives Activity, the total notional value of U.S. Banks Derivative Holdings increased from $45 trillion in 2001 to $235 trillion in 2013:
Now, this is only the amount of derivatives at U.S. Banks and Saving Associations. According to several sources, global derivatives shot up to $1,000 trillion or a quadrillion dollars during the same period. Furthermore, the global debt has ballooned from approximately $60 trillion in 2000 to $180 trillion by 2013:
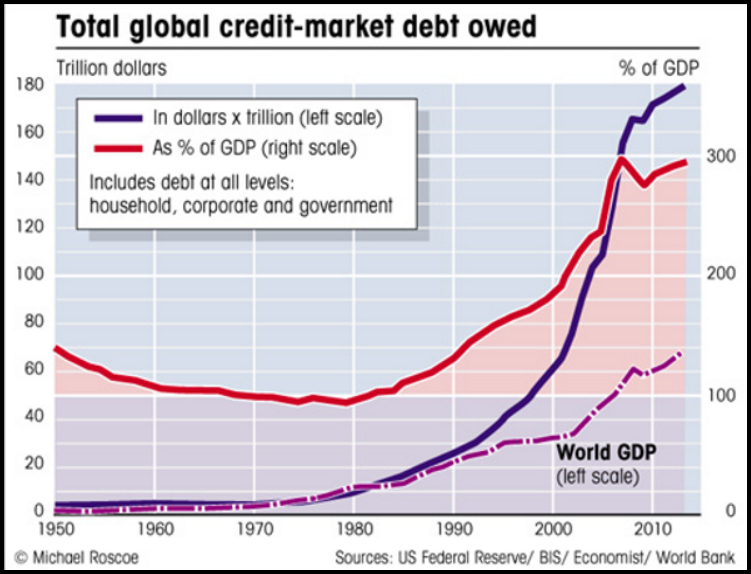
While the current global debt is up even higher to a record $247 trillion, we can clearly see in the chart above how quickly the world’s debt skyrocketed from 2000 to 2013. Thus, the massive increase in global debt and derivatives had a profound impact on the oil price.
As the oil price trended higher from $19 in 1999 to over $100 in 2011 (until mid-2014), this was very supportive to the oil industry. However, now that the oil price is trading below $70, it is putting severe pressure on the marginal producers (Shale Oil, Heavy Oil, Oil Sands and DeepWater) and is not high enough to generate the needed capital expenditures to maintain or grow production in the future.
Furthermore, when the oil price collapses along with the upcoming market crash-correction, it will destroy a great deal of production. I believe the next major market crash will be the major turning point for the END OF THE MIGHTY OIL INDUSTRY.
