
St. Louis, MO-based pharmacy benefit manager Express Scripts Holding Company (NASDAQ:ESRX) posted second-quarter 2017 adjusted earnings per share of $1.73, beating the Zacks Consensus Estimate of $1.71. Furthermore, adjusted earnings jumped from $1.57 per share in the year-ago quarter.
Revenues of $25.35 billion missed the Zacks Consensus Estimate of $25.40 billion but were up roughly 0.5% on a year-over-year basis.
Q2 Highlights
Adjusted gross profit in the second quarter was flat year over year at $2.16 billion. Adjusted selling, general and administrative expenses were $782.6 million, down 13.5% from the prior-year quarter. Total adjusted claims amounted to 350.0 million in the second quarter, flat year over year.
The company’s EBITDA (earnings before interest, tax, depreciation and amortization) witnessed a 1% rise to $1,824.1 million in the second quarter. The upside was driven by operational cost improvement backed by focus on technology, digital tools, home delivery and specialty services.
Balance Sheet
The company exited the quarter with cash and cash equivalents of $2.35 billion compared with $3.08 billion at the end of 2016. Total debt, at the end of the quarter was $13.84 billion versus $14.85 billion at the end of 2016. In fact, the company is striving to reduce its debt levels.
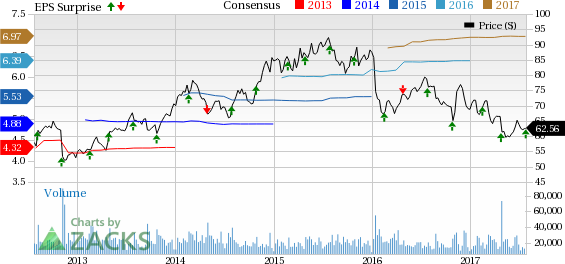
Express Scripts Holding Company Price, Consensus and EPS Surprise
Express Scripts Holding Company Price, Consensus and EPS Surprise | Express Scripts Holding Company Quote
Guidance Raised
The company raised its guidance for 2017 adjusted earnings. For fiscal 2017, adjusted earnings per share are projected in the band of $6.95 to $7.05, up from the previously provided range of $6.90 to $7.04. This represents 10% increase at the mid-point of the range.
Coming to the guidance for the third quarter of 2017, Express Scripts expects total adjusted claims in the range of $340 million to $350 million. Adjusted earnings per diluted share for the third quarter are estimated in the range of $1.88 to $1.92, representing growth of 8% to 10% on a year-over-year basis.
Furthermore, the company anticipates compounded annual EBITDA growth rate between 2% to 4% from 2017 through 2020 for the core PBM business. This excludes any contribution from Anthem and other transitioning clients.
Express Scripts Likely to Lose Anthem
Express Scripts recently announced that its biggest customer, the leading health insurer Anthem Inc. (NYSE:ANTM) , is not likely to extend its pharmacy-benefits management agreement, which is slated for expiration by the end of 2019. In 2016, Anthem sued Express Scripts for overcharging its drugs and operational failures. Per management, Anthem refused to participate in further discussions on pricing concessions and probable adjustments for the agreement. Meanwhile, in the second quarter of 2017, Anthem generated $52.6 million in revenues compared with $106.6 million in the second quarter of 2016.
Our Take
We are highly upbeat about the company’s core pharmacy-benefits management long-term outlook. This includes the ongoing volatile healthcare market trends, inflation, patent expiration, lower industry utilization growth and other headwinds.
Furthermore, we expect Express Scripts to continue to benefit from increased generic utilization, shift toward mail orders, strong specialty growth and an aging population. Branded drugs are becoming increasingly expensive due to double-digit brand inflation, continued rise in the price of specialty drugs and an overwhelming regulatory burden that is actually paving the way for manifold prospects for generics.
Key Picks
Notably, Express Scripts currently has a Zacks Rank #3 (Hold).
Better-ranked stocks in the broader medical sector include INSYS Therapeutics, Inc. (NASDAQ:INSY) and Align Technology, Inc. (NASDAQ:ALGN) . Notably, INSYS Therapeutics sports a Zacks Rank #1 (Strong Buy), while Align Technology carry a Zacks Rank #2 (Buy). You can see the complete list of today’s Zacks #1 Rank stocks here.
INSYS Therapeutics has a long-term expected earnings growth rate of 20%. The stock has gained around 15.9% in the last three months.
Align Technology has an expected long-term adjusted earnings growth of almost 24.1%. The stock has added roughly 35.7% in the last three months.
The Hottest Tech Mega-Trend of All
Last year, it generated $8 billion in global revenues. By 2020, it's predicted to blast through the roof to $47 billion. Famed investor Mark Cuban says it will produce ""the world's second trillionaires,"" but that should still leave plenty of money for regular investors who make the right trades early.
See Zacks' 3 Best Stocks to Play This Trend >>
Insys Therapeutics, Inc. (INSY): Free Stock Analysis Report
Anthem, Inc. (ANTM): Free Stock Analysis Report
Align Technology, Inc. (ALGN): Free Stock Analysis Report
Express Scripts Holding Company (ESRX): Free Stock Analysis Report
Original post