
Share price of Expedia Inc. (NASDAQ:EXPE) rallied to a new 52-week high of $152.83, eventually closing a tad bit lower at $152.00 on Jun 22.
Currently, the company has a Zacks Rank #3 (Hold). Notably, the stock has a market cap of $22.94 billion.
Key Factors
The rally in the stock can be attributed to Expedia’s positive guidance and improving loss figure. Management expects EBITDA growth rate including the ramp-up in cloud spending for full-year 2017 to be in the range of 10% to 15%. Excluding cloud expenses, it is expected to be in the range of 14% to 19%.
Additionally, management trimmed the capital expenditure (CapEx) forecast a bit. It expects CapEx excluding cost related to its headquarters project to be down year over year. Depreciation expense is expected to rise in the mid-20% range. However, the rate of increase will decelerate from the first quarter through the end of the year.
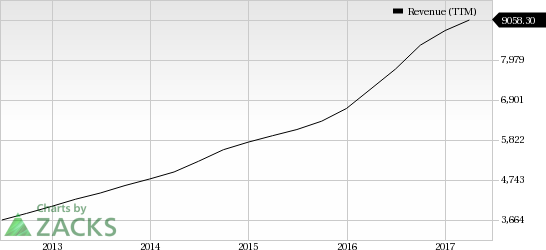
Expedia’s narrower-than-expected first quarter loss and 15% year-on-year revenue growth are also positives. The company’s impressive first-quarter results backed the share price momentum.
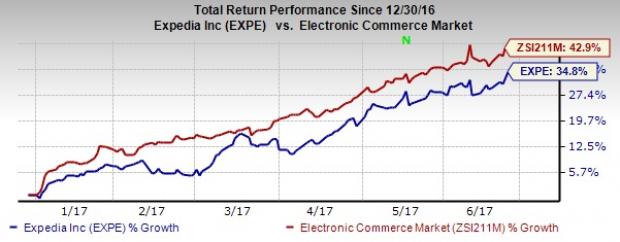
However, we note that the company has underperformed the Zacks Electronics Commerce Market on a year-to-date basis. While the industry gained 42.9%, the stock returned 34.8% over the same time frame.
Moreover, trivago (NASDAQ:TRVG) , Egencia and HomeAway grew 62.5%, 11.8% and 30.3%, respectively on a year-over-year basis in the first quarter. Though the revenue growth trend looks promising, cloud spending, estimated at $110 million for 2017, remains a concern.
Estimate Revisions
The Zacks Consensus Estimate for fiscal 2017 remained unchanged at $4.18 over the last 30 days. For fiscal 2018, the consensus estimate remained unchanged at $5.69 over the same time period.
Stocks to Consider
Better-ranked stocks in the broader computer-software market include Applied Optoelectronics, Inc. (NASDAQ:AAOI) and Applied Materials, Inc. (NASDAQ:AMAT) , both sporting a Zacks Rank #1 (Strong Buy). You can see the complete list of today’s Zacks Rank #1 stocks here.
The Best & Worst of Zacks
Today you are invited to download the full, up-to-the-minute list of 220 Zacks Rank #1 "Strong Buys" free of charge. From 1988 through 2015 this list has averaged a stellar gain of +25% per year. Plus, you may download 220 Zacks Rank #5 "Strong Sells." Even though this list holds many stocks that seem to be solid, it has historically performed 6X worse than the market.
See these critical buys and sells free >>
Expedia, Inc. (EXPE): Free Stock Analysis Report
Trivago N.V. ADS (TRVG): Free Stock Analysis Report
Applied Optoelectronics, Inc. (AAOI): Free Stock Analysis Report
Applied Materials, Inc. (AMAT): Free Stock Analysis Report
Original post
Zacks Investment Research