
This morning's release of the April Existing-Home Sales declined from the previous month to a seasonally adjusted annual rate of 5.57 million units. The March count was downwardly revised from 5.71 million to 5.70 million. The Investing.com consensus was for 5.65 million. The latest number represents a 2.3% decrease from the previous month and a 1.6% increase year-over-year.
Here is an excerpt from today's report from the National Association of Realtors.
Lawrence Yun, NAR chief economist, says every major region except for the Midwest saw a retreat in existing sales in April. "Last month's dip in closings was somewhat expected given that there was such a strong sales increase in March at 4.2 percent, and new and existing inventory is not keeping up with the fast pace homes are coming off the market," he said. "Demand is easily outstripping supply in most of the country and it's stymieing many prospective buyers from finding a home to purchase." [Full Report]
For a longer-term perspective, here is a snapshot of the data series, which comes from the National Association of Realtors. The data since January 1999 was previously available in the St. Louis Fed's FRED repository and is now only available from January 2013. It can be found here.
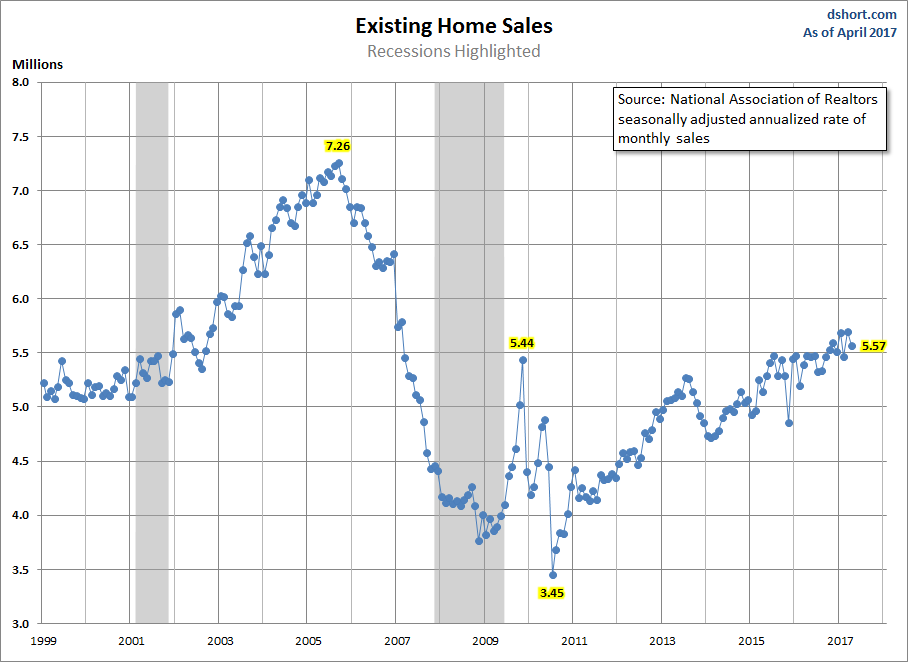
Over this time frame, we clearly see the Real Estate Bubble, which peaked in 2005 and then fell dramatically. Sales were volatile for the first year or so following the Great Recession. The latest estimate puts us back to levels reached before the recession.
The Population-Adjusted Reality
Now let's examine the data with a simple population adjustment. The Census Bureau's mid-month population estimates show a 17.0% increase in the US population since the turn of the century. The snapshot below is an overlay of the NAR's annualized estimates with a population-adjusted version.
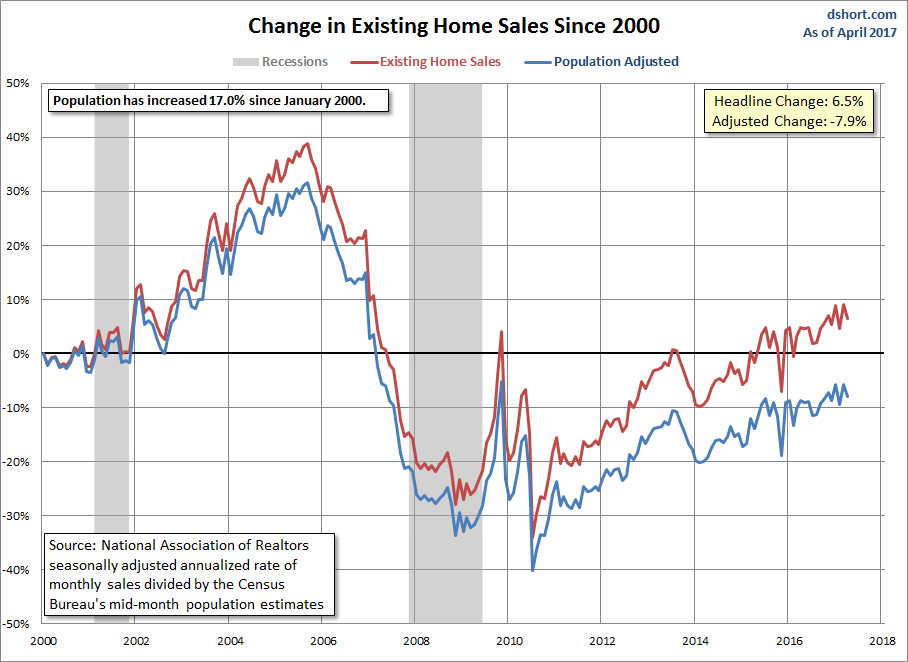
Existing-home sales are 6.5% above the NAR's January 2000 estimate. The population-adjusted version is 7.9% below the turn-of-the-century sales.