Get 40% Off
👀 👁 🧿 All eyes on Biogen, up +4,56% after posting earnings. Our AI picked it in March 2024.
Which stocks will surge next?
Unlock AI-picked Stocks

EUR/USD: Watch Today's Close

Published 10/02/2020, 10:14 AM

The EUR/USD forex market on the daily chart has had 2 small legs up from the low this week. There is already a wedge bear channel that began with the small bull bar on Sept. 24. But if this rally is just a bear flag and a test of resistance at the EMA and Sept. 17 low, there might be one more small bull day left in the next couple days.
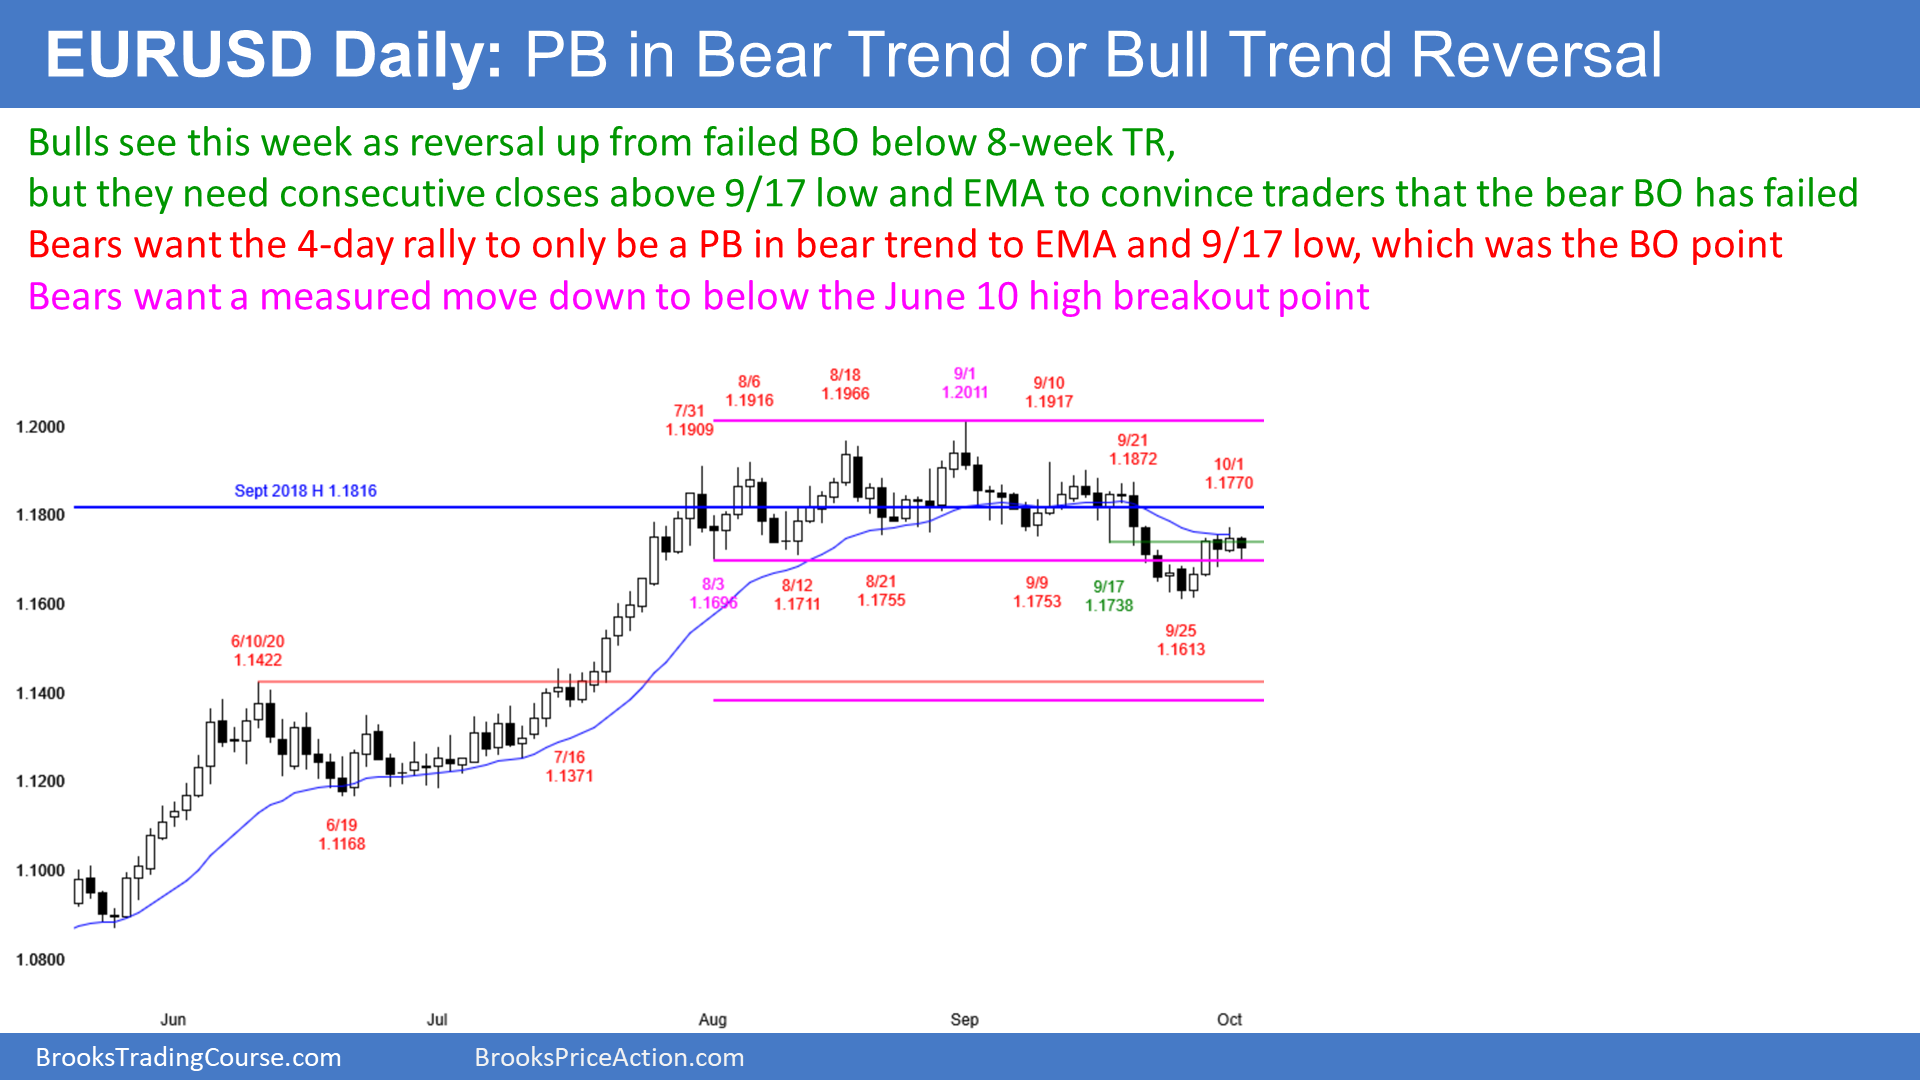
EUR/USD Daily
If today or Monday is a big bull day that closes near its high and far above the Sept. 17 low, traders will conclude that last week’s bear breakout failed. The EUR/USD would be back its 2-month trading range. For traders to conclude that the July bull trend is resuming, they will need a strong break above the Sept. 1 high.

For 2 months, the bars have been small, the legs up and down have lasted only a week or so, and many bars have had prominent tails. This is trading range price action, which reduces the chance of a big breakout in either direction. Traders continue to look for reversals. They exit in a few days and then look for another another trade in either direction.

This week is a bull bar on the weekly chart. The bulls want the week to close near the high of the week, which is yesterday’s high. If it does, that will increase the chance that last week’s bear breakout failed, and it would increase the chance of higher prices next week. If this week has a big tail on top, which it currently has (not shown), traders will look for more sideways trading next week.

3rd party Ad. Not an offer or recommendation by Investing.com. See disclosure here or remove ads .

Overnight EUR/USD Forex Trading

The 5-minute chart of the EUR/USD Forex market traded below yesterday’s low, but reversed up. Yesterday was a Low 1 sell signal bar on the daily chart, but it had a bull body. Traders expected that there would be more buyers than sellers below its low.

The reversal up was not particularly strong and the EURUSD has been in a 40-pip tall trading range for most of the session. The trading range is currently a triangle. Day traders are buying reversals up from the low and selling reversals down from the high, and they are scalping.

The 2 bull overnight legs were stronger than the bear legs. That reduces the chance of a bear trend day.

The fight today will be over the close. The bears want today to close near its low and below yesterday’s low. That will increase the chance of lower prices next week. The bulls want the day and week to close near its high. That will increase the chance of higher prices next week.

Latest comments

Nice
lol
You have better analysis? Please provide us.
 I do; The EU inflation rate now standing at 0.2% means A: they're in a bad place to create liqiuduity to cover the PEP program which was agreed when Inflation was @1.4% and B: when this settles, they'll have 3 trillion in the bank (surplus) that nobody wants to borrow against. all along with their primary repayment guarantee generating GDP across the BLOC of Bank Stocks and Exports subsidising their debt, which is now flat; I would say, yes they're in a mess!!!! Don't read a FX chart and assume you can detemine the fiscal direction and monetary policy of the Euro and USD by drawing lines!
Risk Disclosure: Trading in financial instruments and/or cryptocurrencies involves high risks including the risk of losing some, or all, of your investment amount, and may not be suitable for all investors. Prices of cryptocurrencies are extremely volatile and may be affected by external factors such as financial, regulatory or political events. Trading on margin increases the financial risks.
Before deciding to trade in financial instrument or cryptocurrencies you should be fully informed of the risks and costs associated with trading the financial markets, carefully consider your investment objectives, level of experience, and risk appetite, and seek professional advice where needed.
Fusion Media would like to remind you that the data contained in this website is not necessarily real-time nor accurate. The data and prices on the website are not necessarily provided by any market or exchange, but may be provided by market makers, and so prices may not be accurate and may differ from the actual price at any given market, meaning prices are indicative and not appropriate for trading purposes. Fusion Media and any provider of the data contained in this website will not accept liability for any loss or damage as a result of your trading, or your reliance on the information contained within this website.
It is prohibited to use, store, reproduce, display, modify, transmit or distribute the data contained in this website without the explicit prior written permission of Fusion Media and/or the data provider. All intellectual property rights are reserved by the providers and/or the exchange providing the data contained in this website.
Fusion Media may be compensated by the advertisers that appear on the website, based on your interaction with the advertisements or advertisers.
© 2007-2024 - Fusion Media Limited. All Rights Reserved.