
Volumes, Correlations, Price Action for Aug 16th
EUR/USD: Tentative Bottom as Buy-Side Volume Back
Volume, Correlations, Fundamentals (H4)
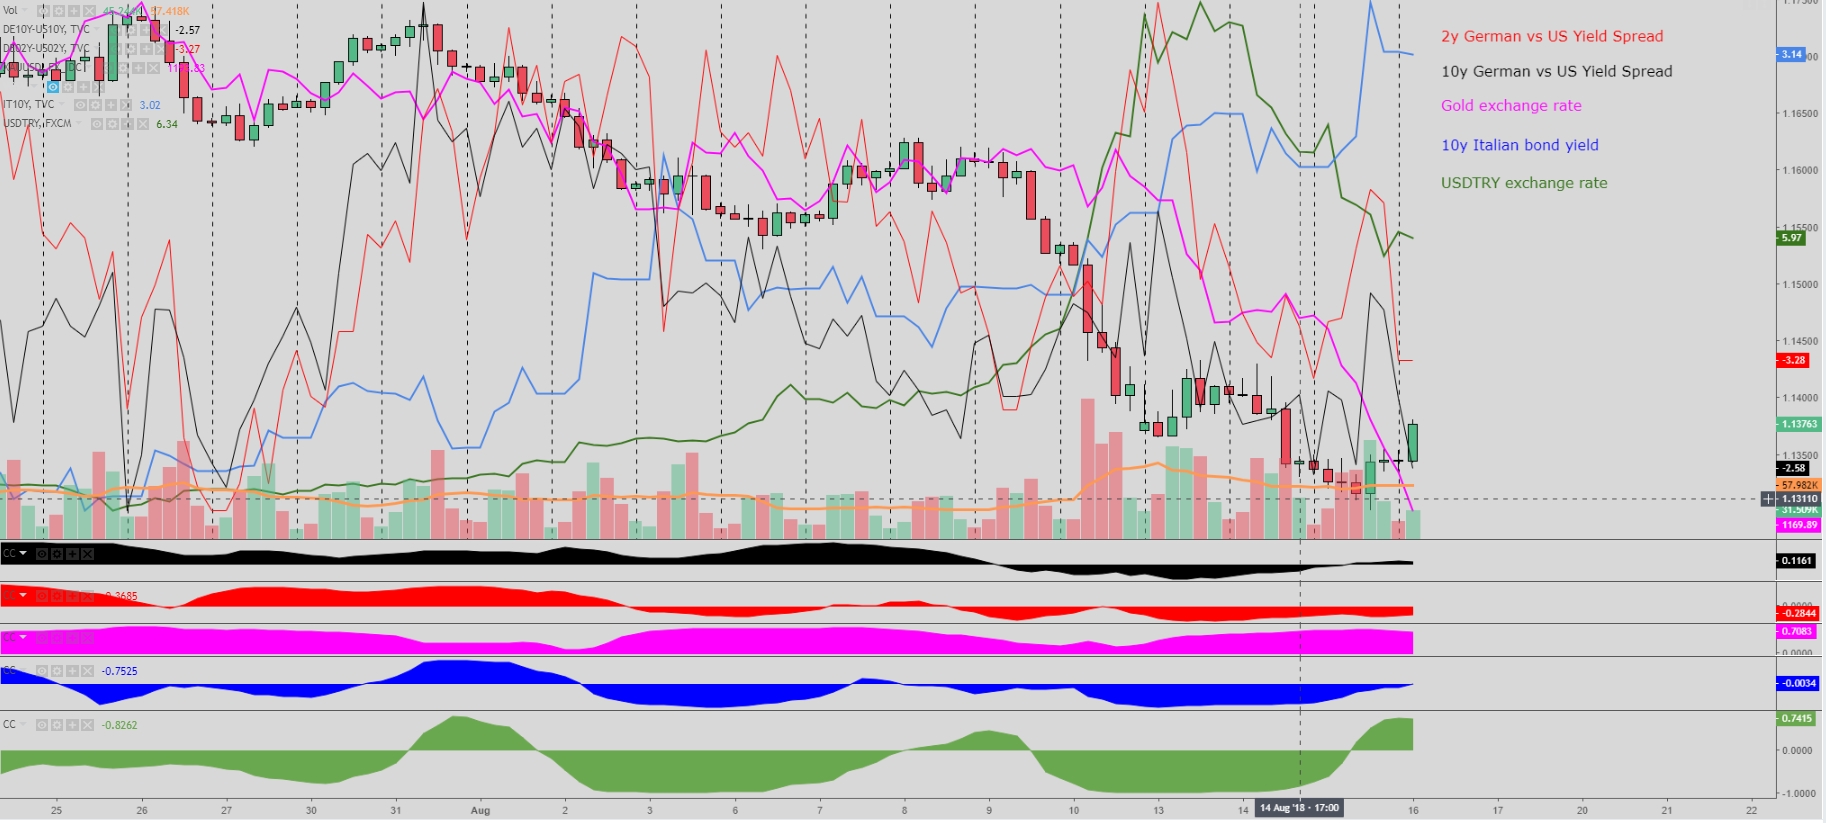
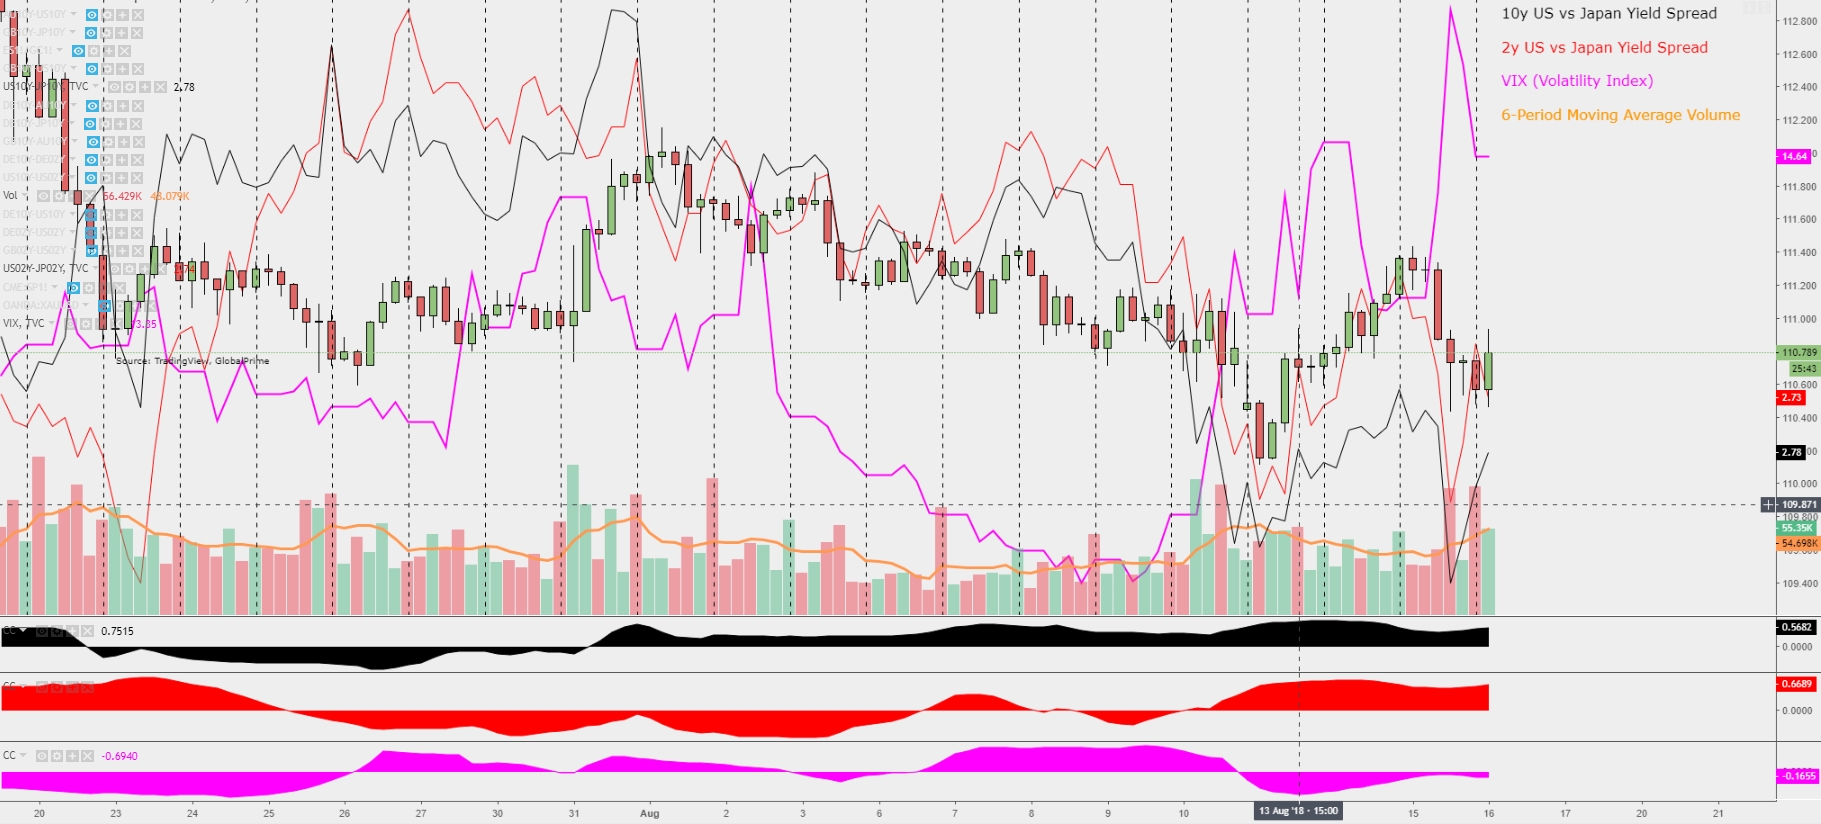
The Euro/US Dollar exchange rate exhibits tentative hints of an interim bottom after the print of a bullish outside bar with higher-than-average volumes. The price formation occurs within the context of a well-established downtrend, which warrants caution and suggests that further upside progression is needed to disrupt the current bearish structure. However, the price action and volumes indicate that a potential rotation into a higher price equilibrium might be on the cards. When analyzing the correlation with other key drivers of the Euro, long/short-dated German vs US yield spreads are not providing any advantageous clues, neither is gold nor the fresh spike in Italian yields (EUR negative).
The only consolation for Euro bulls is the fact that the Turkish Lira continues to strengthen, which provides a temporary circuit breaker for further EUR downside. Talking about circuit breakers, the news that China’s Vice Commerce Minister is set to visit the US for trade talks opens up a new venue for investors to rest more at ease, in light of a possible bid to reconcile trade differences. Overall, price and volumes support a temporary recovery in the pair, as does the hopes of a recovery in battered EM, or the counter-intuitive bullish leg to higher-than-expected US retail sales. On the flip side, the structure remains bearish and bond yields are yet to reflect a recovery that may further anchor fresh uplegs in the Euro.
Intraday Chart (30m)
Technically, the ABC-type recovery still looks corrective in nature, with the price still facing some major roadblocks in the form of key resistance areas at 1.1380 (horizontal support), 1.14 (confluence of POC, 100-hourly MA, round number) ahead of 1.1430-35 (macro resistance as per thicker horizontal line). While the latest impulsive leg brightness up the prospects of further buying interest of dips, we are still in a structurally bearish market, despite buyers have won an intraday battle by catching Wed’s sellers wrong-sided. If buyers can find value through the accumulation of volume above the 1.14 area, it will be yet another milestone to reinforce the intraday bullish motion. Should a resumption of the USD buying return, the exchange rate must hold above Wed’s PoC at 1.1325-30 or otherwise an imbalance of offers is expected to take the rate back down to revisit 1.13 ahead of macro support at 1.1290.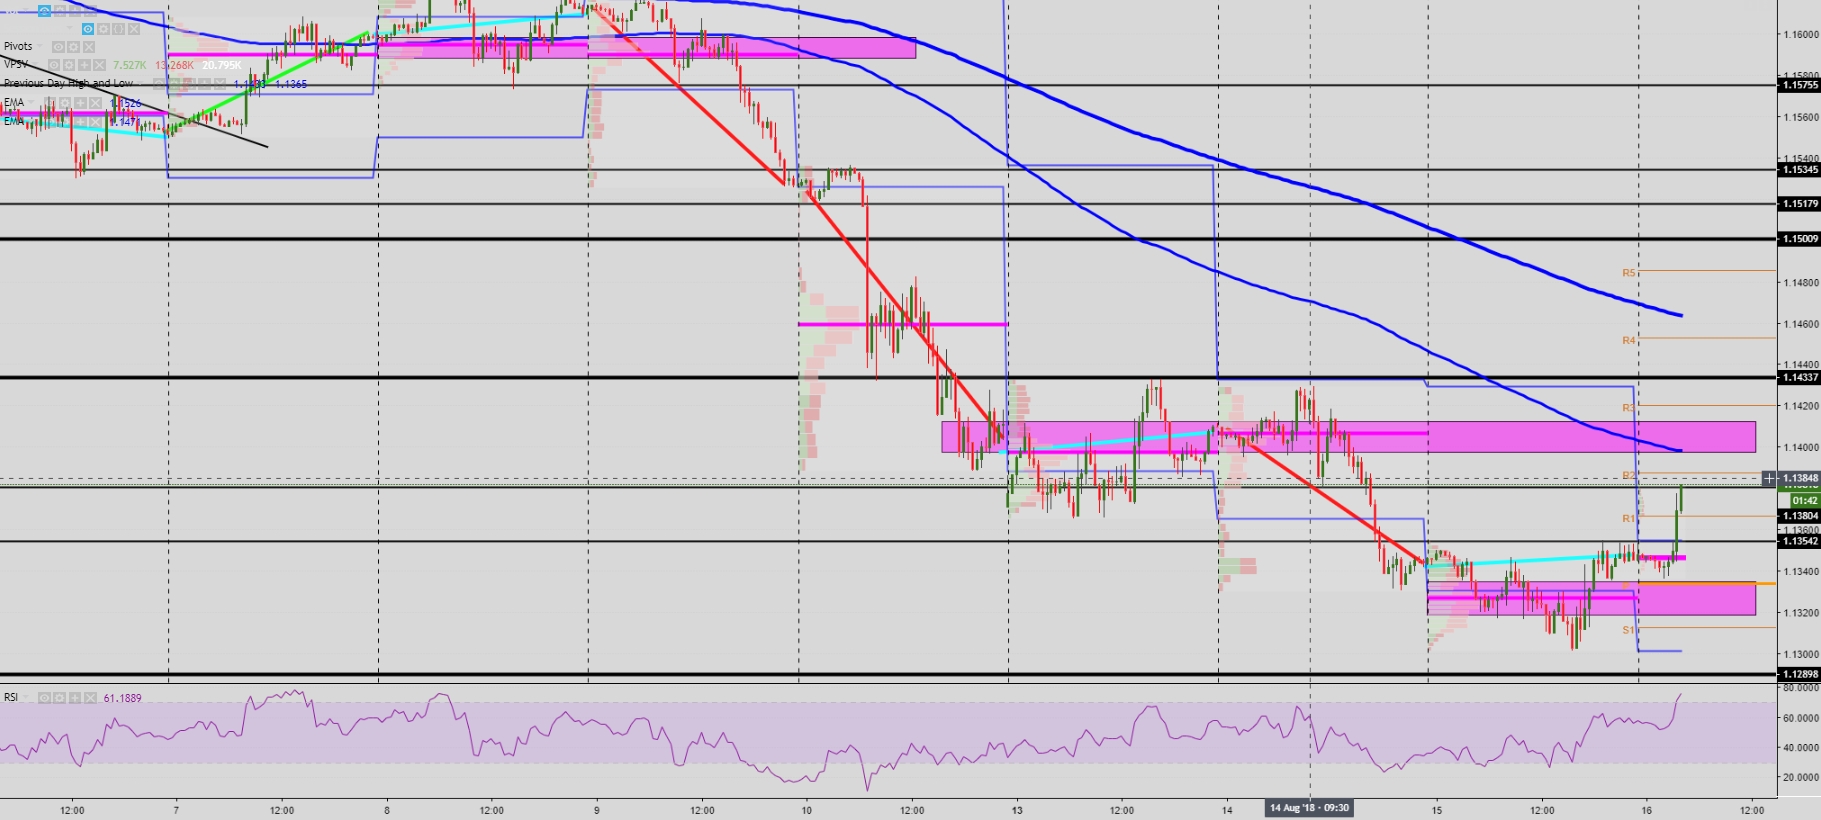
GBP/USD:Sterling in a Meritless Recovery Mode
Volume, Correlations, Fundamentals (H4)
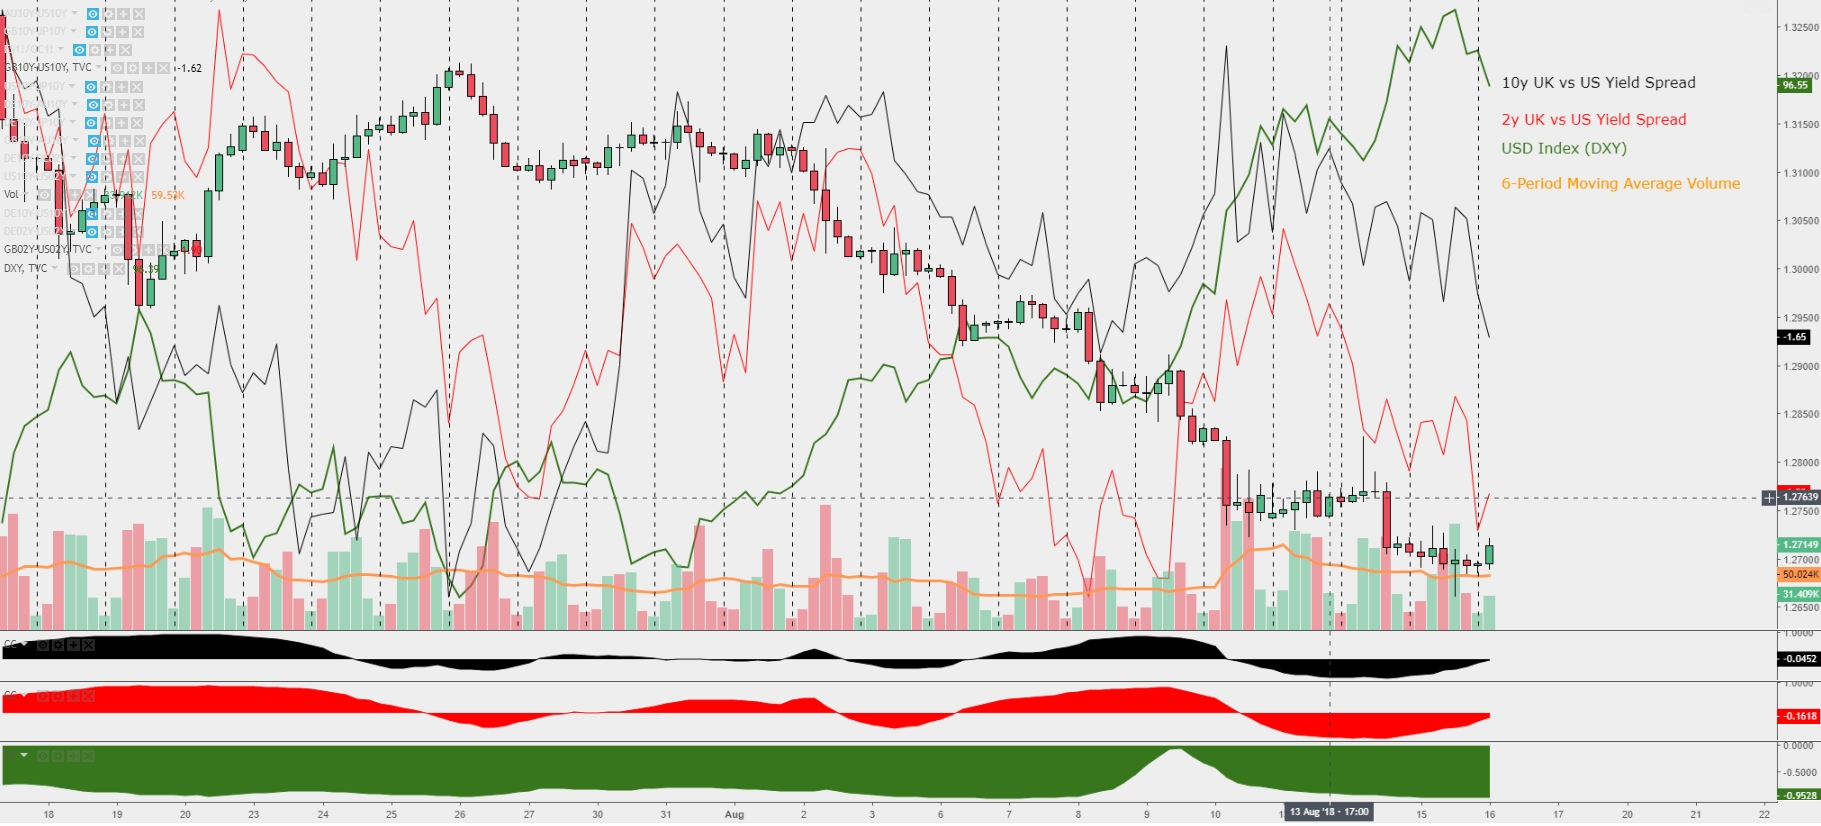
In a more timid manner than the Euro, the Sterling has seen a similar price pattern, with the print of a long lower shadow on high volume, which more often than not constitutes a tentative price reversal. In the case of the Sterling, with such a firm downtrend in place and the outlook for a Brexit no-deal on the rise, one must be extra cautious not to be caught buying relatively expensive Sterlings. What’s more, and while currently not showing a big deal of correlation from a weekly perspective, the decline in the UK vs US 10-yr and 2-yr yield spread should communicate a limited upside potential. Should the Sterling recover further, it’s likely going to be fueled by the demerits of a deflating USD than GBP strength by default. As illustrated in the chart below, the weekly correlation coefficient with the USD is almost100%.
Intraday Chart (30m)
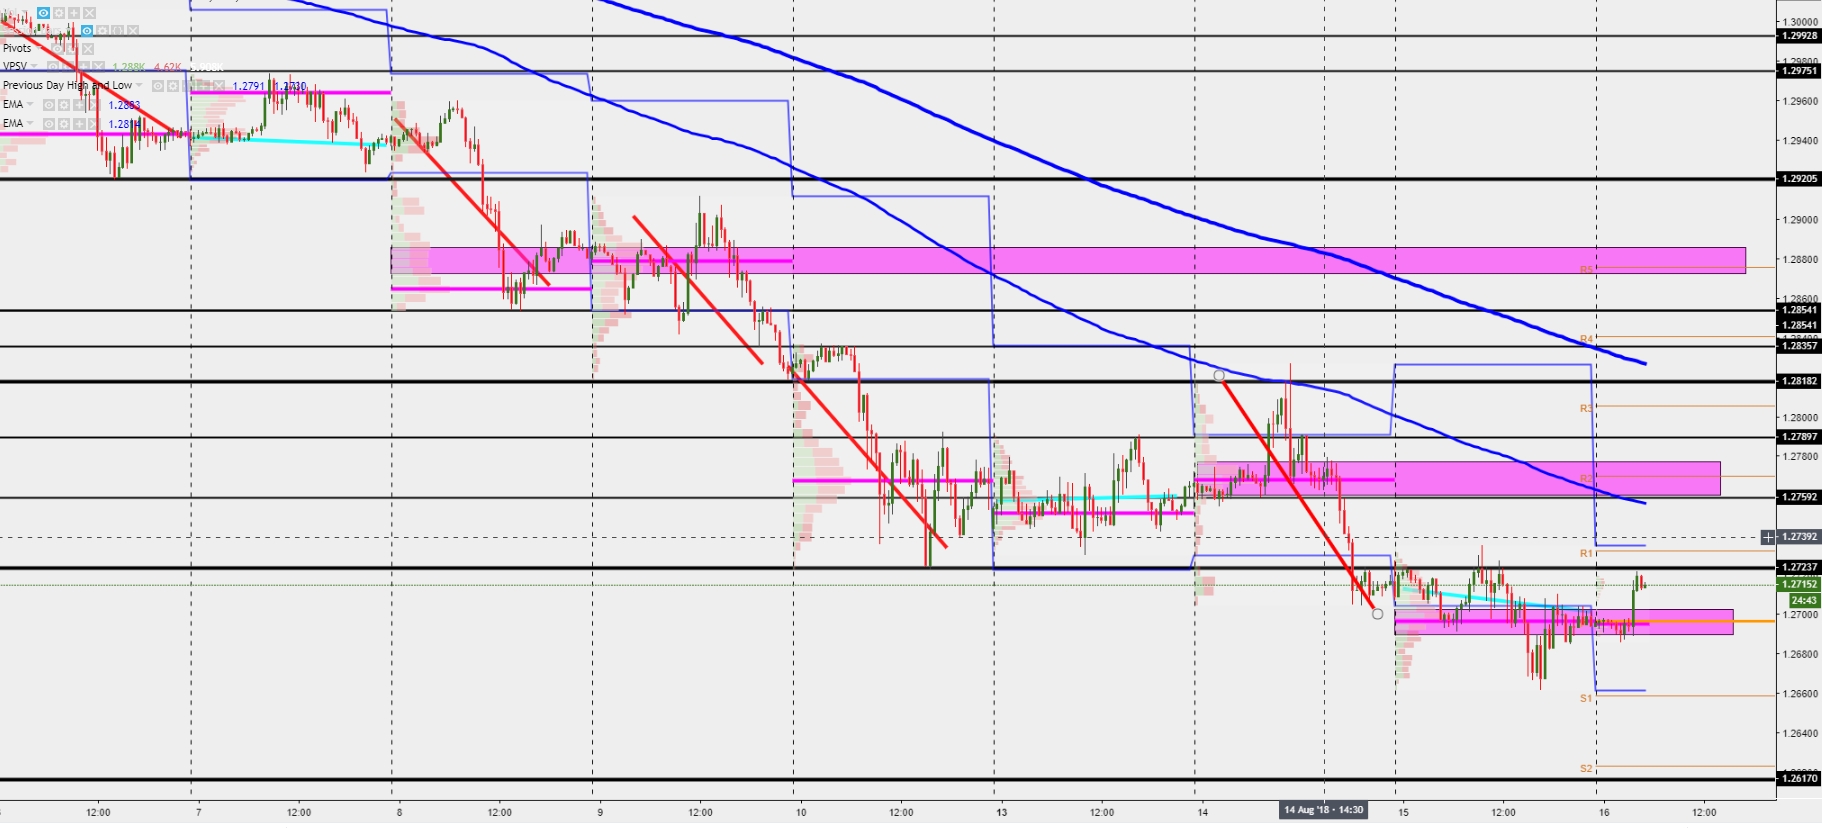
Notwithstanding the failure to print lower levels on Wed, buyers are still to inflict technical damage to what has been so far a rather stable downtrend in place. Unlike in the case of the Euro/US Dollar, the British currency failed to close by NY 5pm at a distance far from its center of equilibrium, in other words, the PoC (Point of Control). The current correction is faced with a major resistance area starting at 1.2720-25, with a break above to face the next obstacle right overhead at 1.2735 (Wed’s high and R1 resistance), with only a breakout above the latter to potentially fuel a 25-30p short squeeze into the 1.2760-70, which will remain absolutely key and is expected to hold (100-hourly MA, PoC, horizontal resist, R3), barring any major surprises originated from today’s UK retail sales. A break above the 1.2760-70 will still face multiple layers of resistance in a fairly close sequence from each other, with 1.2820 a major macro resistance. Remember, to the downside, the exchange rate may still be exposed to a fairly rapid depreciation towards 1.2615-20 as the area carries the risk of being thin in liquidity due to the obvious absence in technical levels of reference.
USD/JPY:Stampede of Sellers But Risk Sentiment Improving
Volume, Correlations, Fundamentals (H4)
The selling wave on Wed came on increasing volume, with the sell-side bars overwhelming those sitting on the bid. The US vs JP 10-yr yield spread saw a retreat near recent lows prior to a mild bounce, while the VIX index rose to the highest since July 5th, communicating that the risk is shifting towards a further setback of price action, notwithstanding the fact that the overall structure continues rather constructive for the interest of buyers given the impulsive recovery seen from the 110.00 round number. One factor that may underpin the bulls today is the report, which is gathering air time and reflected in a higher Yuan and better bid EMs, that China might be ready to go back to the negotiation table with some concessions on trade. The story has enough substance to shift the focus into a more benign risk environment, in which case, the US Dollar/Japanese Yen is expected to perform on an improved bid tone.
Intraday Chart (30m)
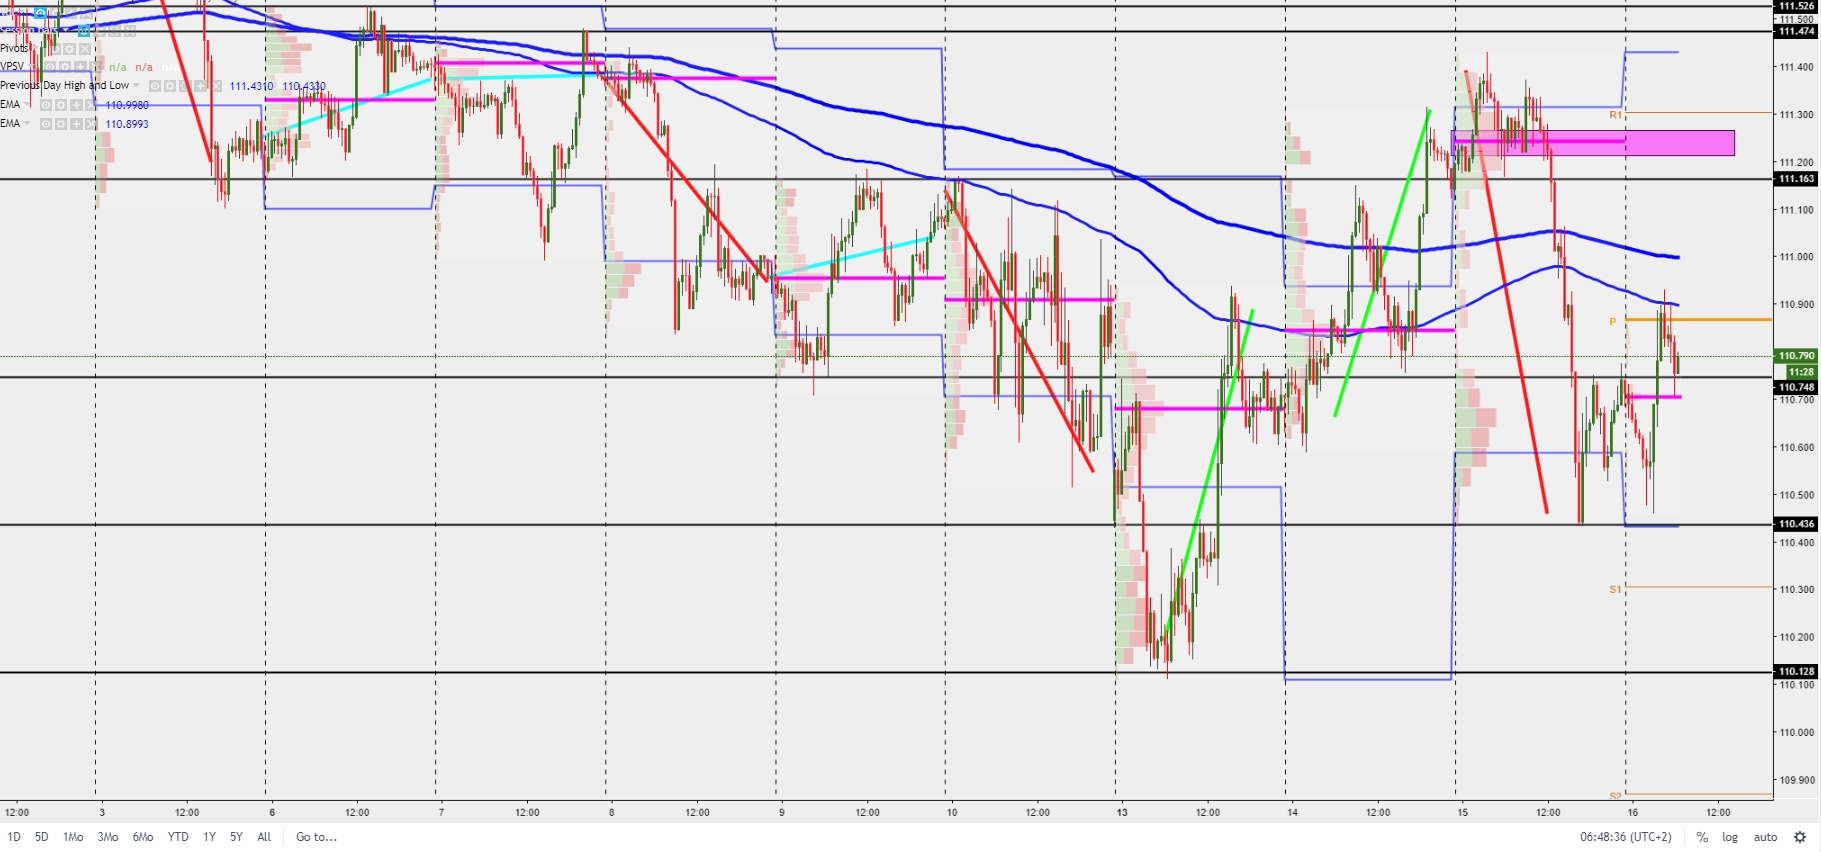
The technicals offer a market that is broadly speaking, controlled by the sellers as per the initiation of a first impulsive cycle down following the 1c. slide that completely distorted the previous 2-day up-cycles. Drilling down into the latest price action though, the aforementioned improvement in risk on the Chinese headlines has led to what might be a short-term recovery in the making, with bids so far finding equilibrium after a breakout of intraday resistance at 110.75, paving the way to expose the filling of offers up towards the 110.90-111.00 zone, where the daily pivot acts as resistance backed up by the 100 & 200-hourly MA, as well as the round number 111.00. A resolution above the latter should expose what’s expected to be a tough nut to crack at 111.15, horizontal resistance and origin of Wed’s supply imbalance, ahead of 111.20-25. Shifting gears, if the focus is back to the downside, buyers must defend the 110.60-65 area or else it will suggest that the recent swing lows of 110.45-50 will be targeted, with a breakout aiming to reach 110.10-110.00.
AUD/USD: Constructive Price Action on Aus jobs, China trade talk
Volume, Correlations, Fundamentals (H4)
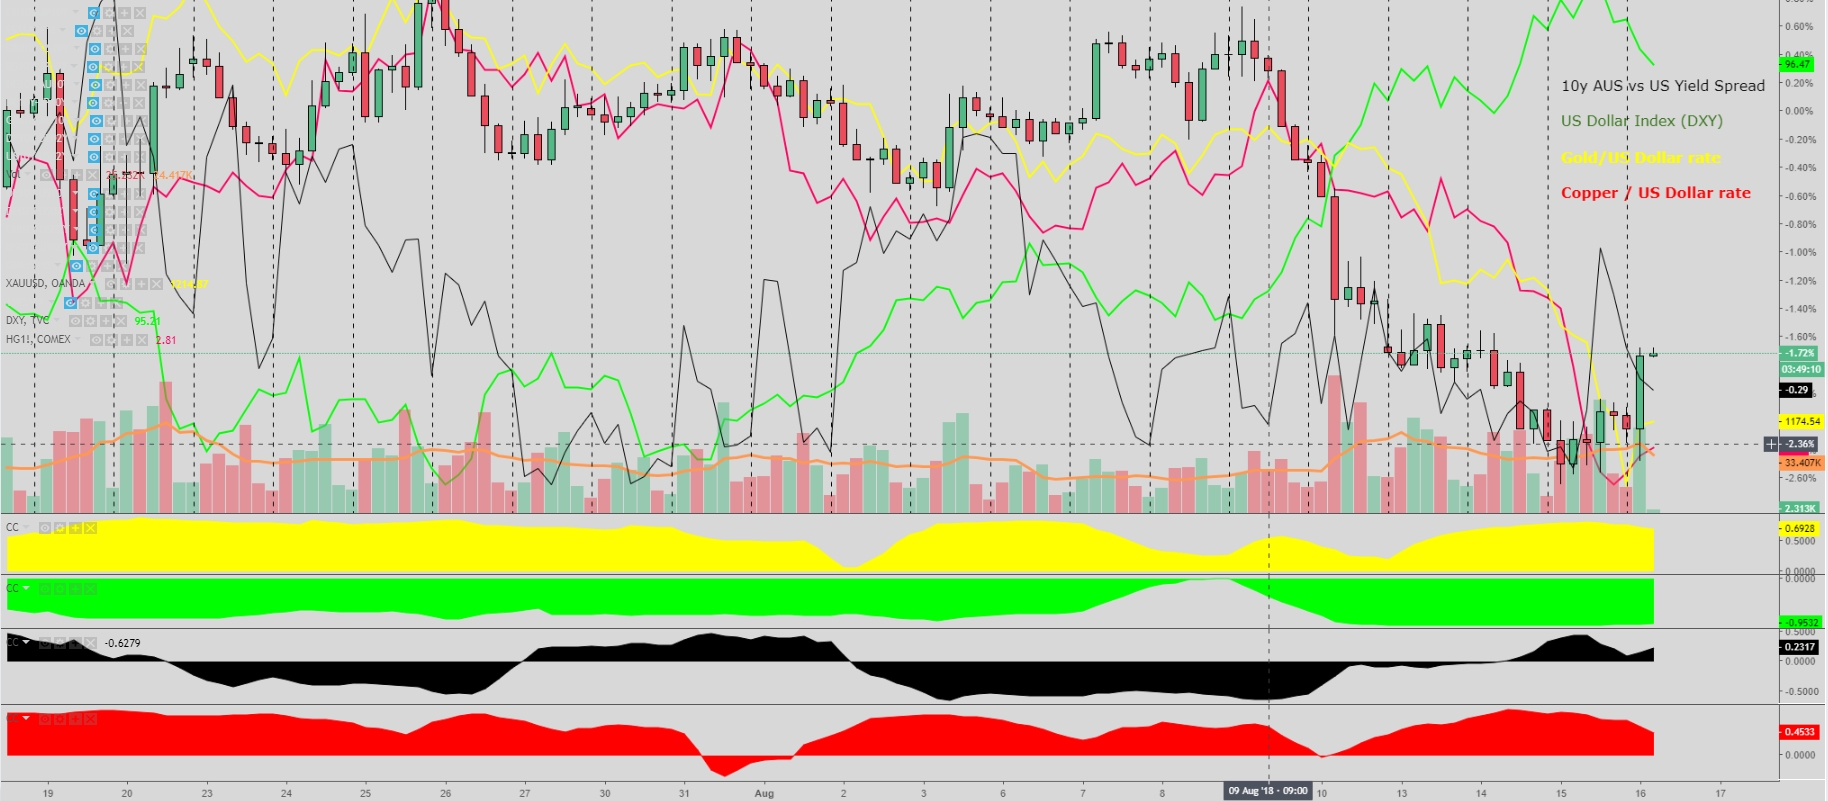
The Australian Dollar is exhibiting bullish tendencies, with the onset of the recovery originated late on Wed and reflected in the chart via a classic textbook bullish engulfing bar followed by low volume sell-side activity retesting the lows. The continuation has then been fueled by solid full-time jobs creation in Australia (despite the headline number was poor) coupled with tentative hopes, – which may be priced in for a few sessions – of a more amicable approach in trade talks between the US and China. The overextension in the Ausie is not backed by Gold or other commodities such as Copper though, trading under immense sell-side pressure this week. On the flip side, the increase in the 10y Aus-US yield spread – poorly correlated on a weekly basis – but most importantly, the retreat in the DXY underpin the ongoing recovery. Note, as a direct proxy to EMs, if we were to see an acceleration of the USD long liquidation, the Aussie is well positioned to muster the most gains in coming days. The early signs of a turnaround in fortunes have certainly appeared.
Intraday Chart (30m)
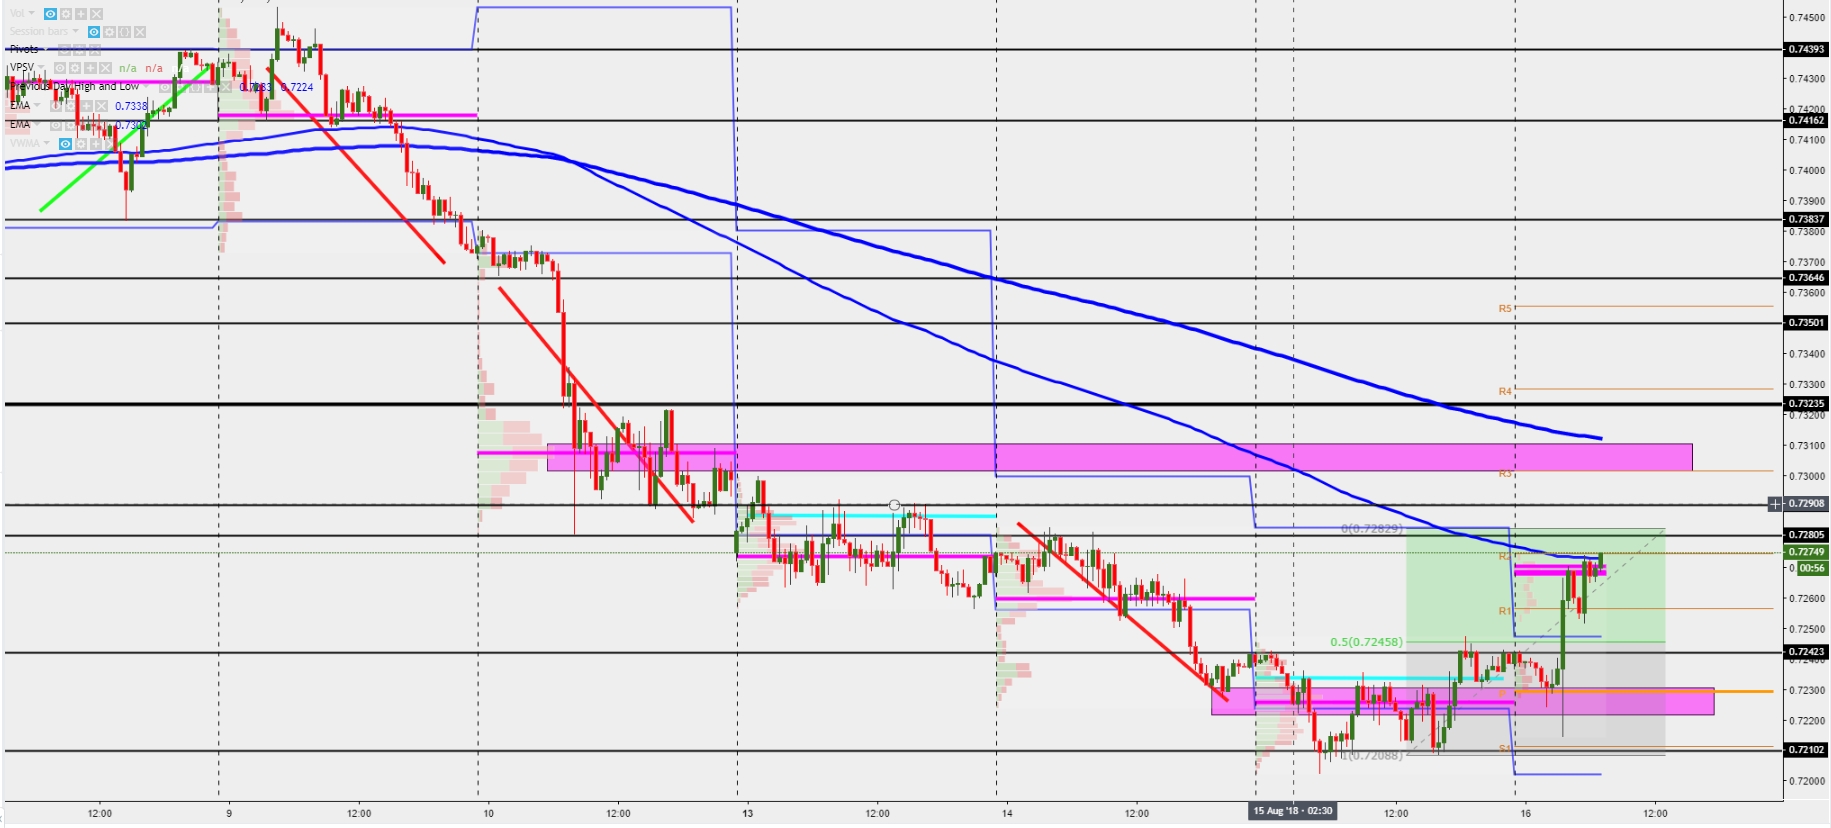
The ongoing momentum in the Aussie should find an increasing number of offers to at least limit the magnitude of the rise, given the the exchange rate has broken above its ADR14d, now retestgn the 100-hourly MA ahead of a double layer of resistances at 7280 & 7290 respectively, followed by the round number 73. One would expect the initial buy-side target where profits are likely to be taken off the table at the 100% fib proj circa 7280. As the price action stands, any pullback faces the prospects of being bid with more conviction as the market structure is starting to shift from bearish into a potentially bullish transition. The areas where one would expect buyers to re-engage in buy-side activity are found at 7240-50 ahead of 7230 (Wed’s PoC). Failure to hold the latter constitutes a risk to crack recent lows, in which case a target of 7150/71 might be on the cards, although for now this is not the base case scenario one should expect ST.
“Past performance is not a reliable indicator of future performance“
Important Footnotes:
The only Moving Averages to apply in the charts will be the 100 & 200-hourly exponential moving averages, which will assist us on the overall directional bias of the market.
The green, red, and aqua lines are utilized to represent the latest Cycles. Markets tend to move in cycles of 3 followed by a period of distribution and/or accumulation. To consider a cycle valid, we need to see a daily move greater than 75% of the 14-period average daily range.
The magenta rectangles in the chart represent the areas of most interest by trading volume, referred as POC – Point of Control –and should act as walls of bids/offers that may result in price reversals. The rectangles will be drawn as long as the area is not absorbed. The volume profile analysis tracks trading activity over a specified time period at specified price levels. The study reveals dominant and/or significant price levels based on volume. This process allows understanding market opacity.
The analysis of Volume activity in the chart provides some great insights into the actual buy or sell-side commitment to be engaged into a specific directional movement.
In the chart we represent Intraday or Macro Support/Resistancelevels by drawing them in black colours, via a thinner black line for intraday support/resistance, while the macro levels of support/resistance will be drawn using a thicker black line.
In a thin blue line we will have the most recent Daily Highs and Lows, which play an important role as areas of support and resistance as well.
To reinforce the key area of interest in an attempt to find confluential levels, we will also use Daily Pivot Levels, which include the pivot point (thick orange) and the subsequent 3 levels of support and resistance derived from the pivot calculations.
The analysis will be conducted from a Top-Down approach by analyzing 2 timeframes. Firstly, we will look at the H4 chart to analyze the big picture, where attention centers around the price action, macro levels, volume analysis and valuations via yield spread. Secondly, we will break down the analysis from a technical perspective through the 30m chart by studying the most likely directional bias based on all the information gathered as well as the levels of major interest for traders.
The Ultimate Purpose of this report is to equip Global Prime’s existing and future clients with a professional institutional-level daily outlook that can assist one’s trading decisions on a regular basis.
Technical analysis is subject to Fundamental-led News. Any unexpected news may cause the price to behave erratically in the short term, while still respecting the most distant price references given.