
EUR/USD: Short-lived recovery after FOMC minutes
Macroeconomic overview: Federal Reserve policymakers appeared increasingly wary about recent weak inflation and some called for halting interest rate hikes until it was clear the trend was transitory, according to the minutes of the U.S. central bank's last policy meeting. The readout of the July 25-26 meeting, released on Wednesday, also indicated the Fed was poised to begin reducing its USD 4.2 trillion portfolio of Treasury bonds and mortgage-backed securities.
Last month's meeting, which concluded with a unanimous decision to leave rates unchanged, was marked by a lengthy discussion about the recent soft inflation readings, the minutes showed.
The central bank's preferred inflation measure dropped to 1.5% in June from 1.8% in February and has remained below its 2% target for more than five years.
"Many participants ... saw some likelihood that inflation might remain below 2% for longer than they currently expected, and several indicated that the risks to the inflation outlook could be tilted to the downside," the Fed said in the minutes.
The inflation retreat has spurred concerns the Fed may have to cool its monetary tightening pace even though the economy is growing moderately and the unemployment rate fell to 4.3% in July, matching a 16-year low touched in May.
The Fed has raised its benchmark overnight lending rate twice this year and forecasts one more rise before the end of 2017.
Some policymakers argued last month against future rate rises until there was more concrete evidence that inflation was moving back toward the Fed's objective, according to the minutes. Others, however, cautioned that such a delay could cause an eventual overshooting in inflation given a tightening labor market "that would likely be costly to reverse."
The EUR/USD rallied after the release of FOMC minutes. Even though the euro stumbled on Wednesday after sources signalled European Central Bank chief Mario Draghi would not use his Jackson Hole appearance to signal policy change by the bank, investors remain bullish about the currency's outlook.
Technical analysis: The EUR/USD failed to close 14-day exponential moving average yesterday despite the drop to 1.1681. The pair is likely to test this level again today, but this resistance area has already proved to be too strong twice – on August 15 and 16. A close below 1.1680 may open the way to stronger drop. 
Short-term signal: We had opened long position yesterday but the EUR/USD recovery was short-lived and our position was stopped today. Yesterday’s hammer on a daily chart was a false buying signal. Today’s price action suggests further EUR/USD fall is a more likely scenario. We have opened EUR/USD short at 1.1693 with the target at 1.1575.
Long-term outlook: Bullish
AUD/USD: Mixed jobs report from Australia
Macroeconomic overview: Australia's jobless rate ticked lower in July led by a big bounce in part-time work while full-time employment fell, a mixed result that augurs poorly for wages growth and the course of inflation.
The unemployment rate slipped to 5.6% from an upwardly revised 5.7% in June as 27.9k new jobs were added, the Australian Bureau of Statistics said on Thursday.
But the gain was led solely by a jump of 48.2k in part-time work. Full-time jobs stumbled in July after a strong run recently. They still account for almost all of the gains in employment this year.
The Reserve Bank of Australia had welcomed a sharp turnaround in the labour market this year after full-time jobs fell 23.1k in 2016. But policymakers continue to fret over high spare capacity and its impact on wages growth which is languishing at record lows of 1.9%.
That is also putting downward pressure on inflation which remains below the RBA's 2% to 3% target band, forcing the RBA to slash interest rates twice last year to a record low 1.50%. It has stood pat on policy since then.
Still, the RBA is confident of a revival with measures of business confidence and conditions at a decade high. National Australia Bank surveyed more than 400 firms to compile its index of business conditions which rose 1 point to +15 in July, triple its long-run average of +5.
Technical analysis: The AUD/USD pierced 7- and 14-day exponential moving averages after a sharp rally yesterday. Daily RSI is biased up. But today’s renewed USD strength is a risk to AUD bulls. 
Short-term signal: We have cancelled our AUD/USD long given today’s renewed USD strength
Long-term outlook: Bullish
TRADING STRATEGIES SUMMARY:
FOREX - MAJOR PAIRS: 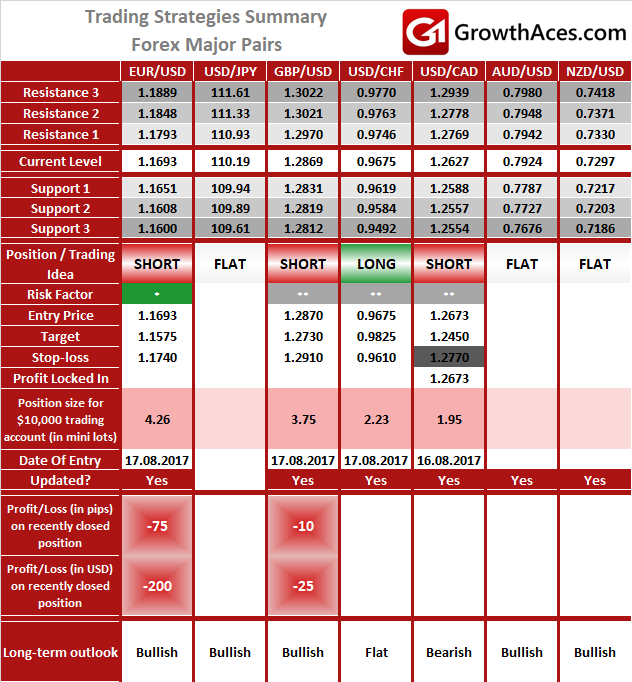
FOREX - MAJOR CROSSES: 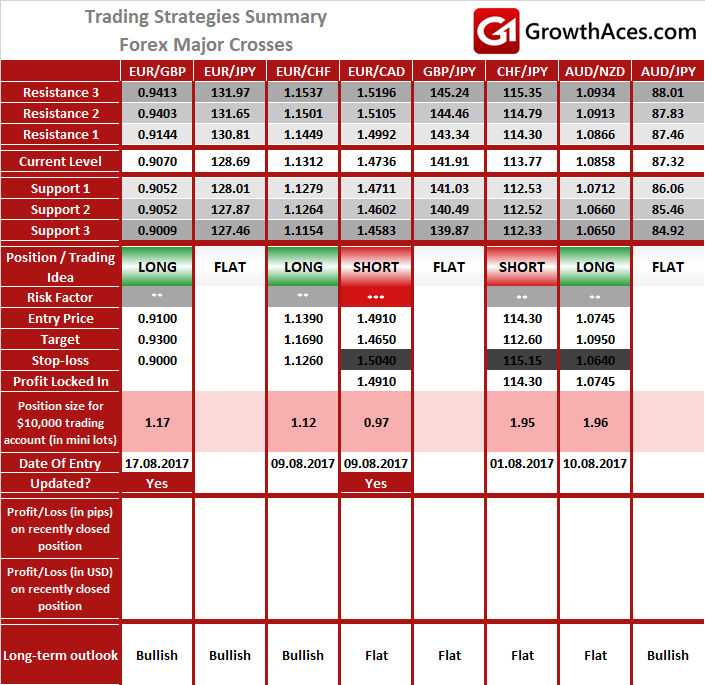
PRECIOUS METALS: 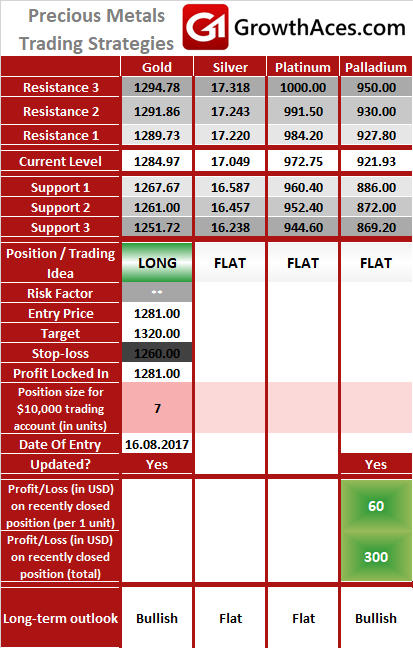
How to read these tables?
1. Support/Resistance - three closest important support/resistance levels
2. Position/Trading Idea:
BUY/SELL - It means we are looking to open LONG/SHORT position at the Entry Price. If the order is filled we will set the suggested Target and Stop-loss level.
LONG/SHORT - It means we have already taken this position at the Entry Price and expect the rate to go up/down to the Target level.
3. Stop-Loss/Profit Locked In - Sometimes we move the stop-loss level above (in case of LONG) or below (in case of SHORT) the Entry price. This means that we have locked in profit on this position.
4. Risk Factor - green "*" means high level of confidence (low level of uncertainty), grey "**" means medium level of confidence, red "***" means low level of confidence (high level of uncertainty)
5. Position Size (forex)- position size suggested for a USD 10,000 trading account in mini lots. You can calculate your position size as follows: (your account size in USD / USD 10,000) * (our position size). You should always round the result down. For example, if the result was 2.671, your position size should be 2 mini lots. This would be a great tool for your risk management!
Position size (precious metals) - position size suggested for a USD 10,000 trading account in units. You can calculate your position size as follows: (your account size in USD / USD 10,000) * (our position size).
6. Profit/Loss on recently closed position (forex) - is the amount of pips we have earned/lost on recently closed position. The amount in USD is calculated on the assumption of suggested position size for USD 10,000 trading account.
Profit/Loss on recently closed position (precious metals) - is profit/loss we have earned/lost per unit on recently closed position. The amount in USD is calculated on the assumption of suggested position size for USD 10,000 trading account.
Source: GrowthAces.com - your daily forex signals newsletter