
EUR/USD plunged below 1.1260 earlier today. The pair has been steadily declining during the last twelve months and the latest drop suggests a new low is very likely to be reached soon.
But it wasn’t all that clear two weeks ago when the euro was hovering around 1.1400 against the U.S. dollar. Then the Elliott Wave principle came to the rescue. The chart below was sent to our subscribers before the market opened on January 28th. It shows that even though the bears seemed to be the weaker team, they never really left the field.
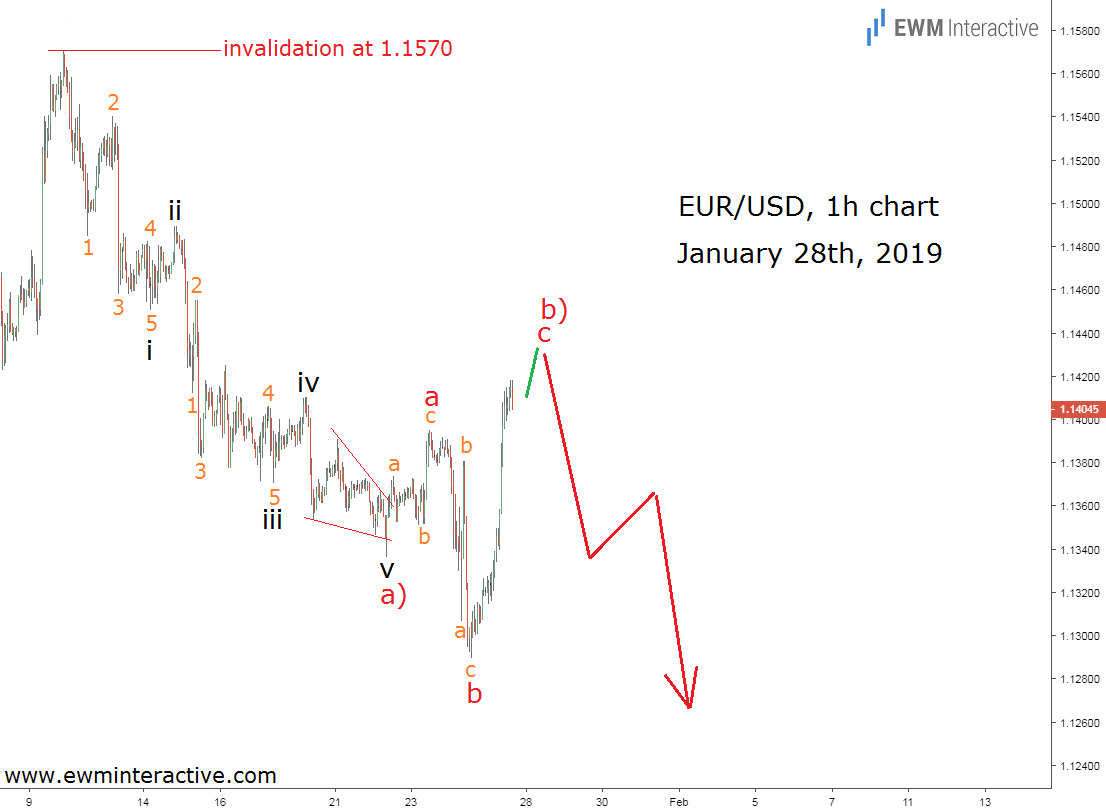
The hourly chart of EURUSD revealed that the drop from 1.1570 was a 5-3 wave cycle. A five-wave impulse labeled i-ii-iii-iv-v in wave a) was followed by an expanding flat correction in wave b).
According to the theory, the trend was supposed to resume in the direction of the impulsive pattern. The exact ending point of wave “c” of b) was still unknown, but as long as 1.1570 was safe, a bearish reversal for the start of wave c) down could be anticipated.
After a while, it became clear that we didn’t predict the termination area of wave “c” very well. Still, there was plenty of room for the bears to return prior to 1.1570.
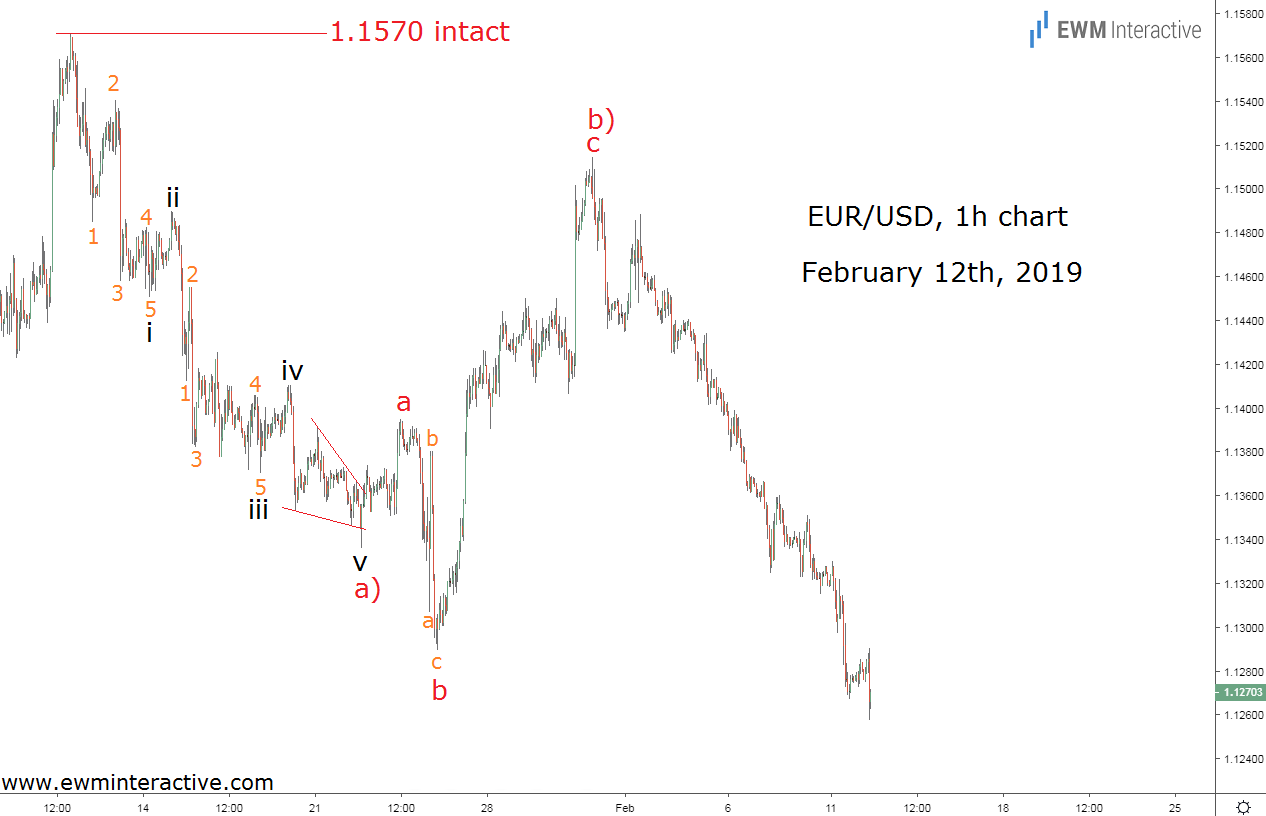
Wave “c” of b) kept climbing until it reached 1.1514. That’s 56 pips lower than our invalidation level, which meant the negative outlook was still intact. What followed was a 256-pip decline to 1.1258 so far.
The bottom line is that even though we can never know exactly what will happen, we can still be successful in the markets. The Elliott Wave principle is a powerful ally, but we should still leave room for error, or “breathing space” for a trading setup to work.