EUR/USD Losing Altitude
Price dropped aggressively after the United States data were released, the greenback received a helping hand from the positive numbers. EUR/USD is in a corrective phase, but this will be temporary if the US will fail to jump and to stabilize somewhere above the 94.00 psychological level.
USDX rebounded on the short term and now is very close to hit a dynamic resistance. The dollar index rallied and erased the morning losses, but has found temporary resistance at the 93.91 level.
Is premature to say that we’ll have a larger rebound on the USDX, only further positive US data will help the greenback to dominate the currency again. USD was boosted by the US numbers in the afternoon, the JOLTS Job Openings increased from 5.70M to 6.16M in June, beating the 5.74M estimate, while the NFIB Small Business Index increased from 103.6 to 105.2 points, exceeding the 103.6 estimate, moreover the IBD/TIPP Economic Optimism increased from 50.2 to 52.2 points, beating the 50.6 estimate.
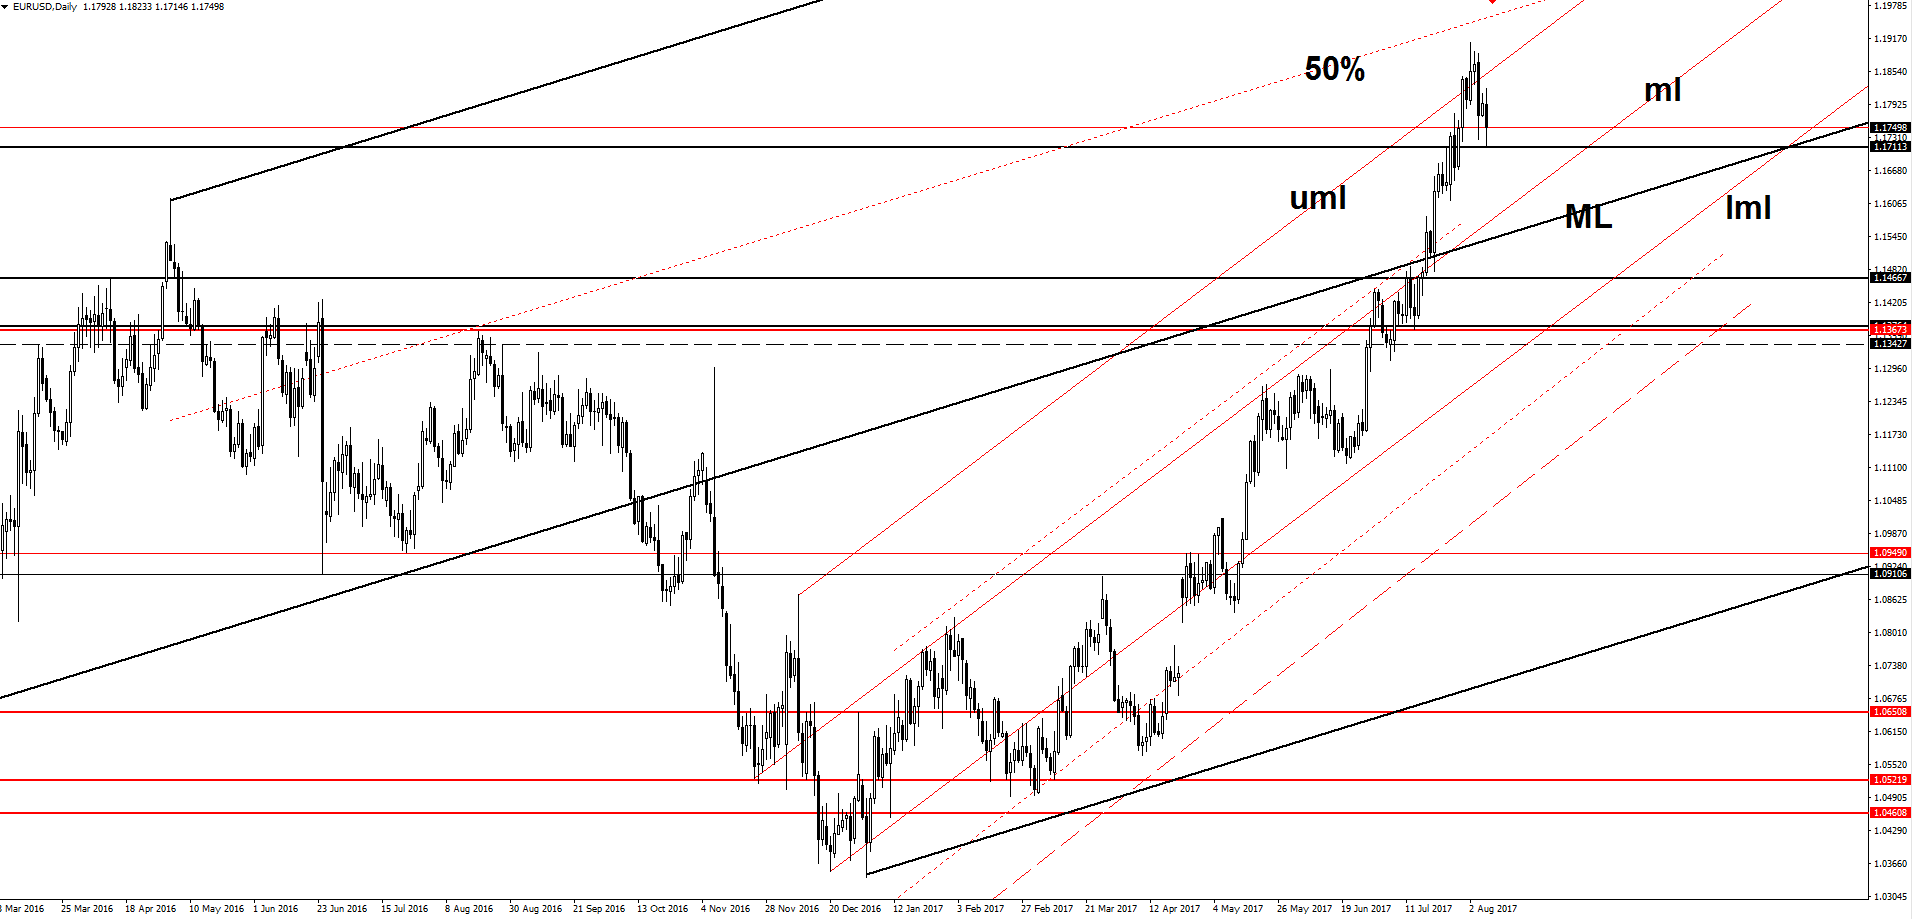
Price extended the sell-off, but was stopped by the 1.1711 static support, only a valid breakdown below this level will confirm a further drop. I’ve said in the previous days that the rate could start a minor consolidation above the 1.1711 downside obstacle till will reach and retest the median line (ml) of the minor ascending pitchfork. The minor correction is natural after the false breakout above the upper median line (uml) and after the failure to reach and retest the 50% Fibonacci line (ascending dotted line). A reversal could be confirmed only if will drop and will stabilize below the median line (ML) of the major ascending pitchfork.
EUR/JPY Another Leg Lower?
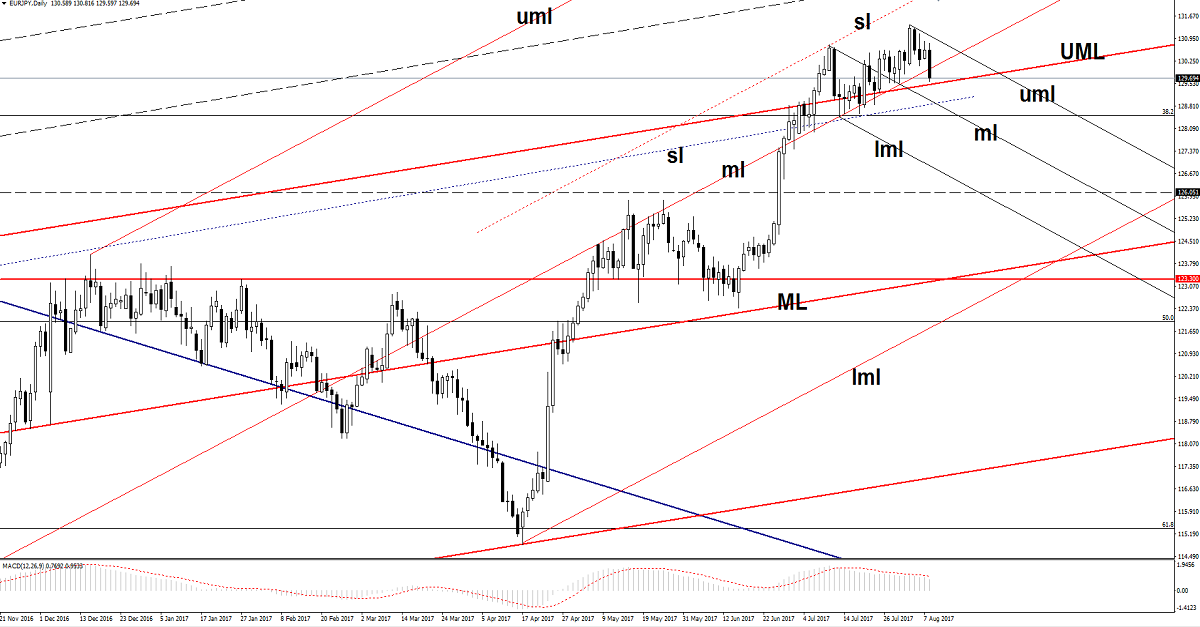
Price is very heavy on the Daily chart and looks unstoppable. You can see that has resumed the bearish movement and dropped below the median line (ml) of the black ascending pitchfork. Right now is approaching the upper median line (UML) of the red ascending pitchfork. A valid breakdown below this level will signal a potential leg lower. I want to remind you that support can be found at the sliding line (SL) and at the 38.2% retracement level as well, but a larger drop could come after the failure to approach and reach the sliding line (sl) of the black ascending pitchfork.
Brent Oil Setting Up For Another Momentum
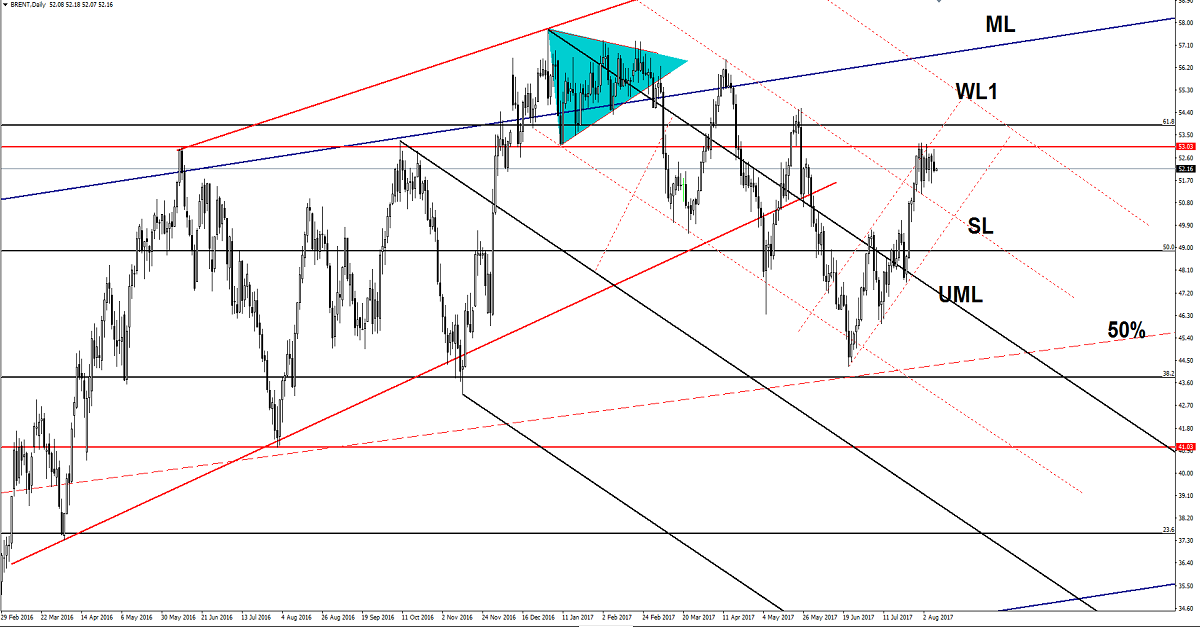
Brent moves in range on the short term, right below the 53.03 static resistance, remains to see if this will be an accumulation or a distribution movement. A minor drop was expected after the failure to close above the 53.03 level. Is trading within a minor ascending channel, so he could come to retest the downside lie of this pattern before will decide where to go.
Risk Disclaimer: Trading in general is very risky and is not suited for everyone. There is always a chance of losing some or all of your initial investment/deposit, so do not invest money you can afford to lose. You are strongly advised to carry out your independent research before making any trading decisions. All the analysis, market reports posted on this site are only educational and do not constitute an investment advice or recommendation to open or close positions on international financial markets. The author is not responsible for any loss of profit or damage which may arise from transactions made based on any information on this web site.


