The GBP/USD steadied near 11-month lows after a decline this week that was fueled by investor fears Britain will leave the European Union without an agreement on its future relationship with the bloc. There are near-term risks of a recovery due the the oversold market, but gains will likely be limited by Wednesday's 1.2960 high. We stay GBP/USD bearish.
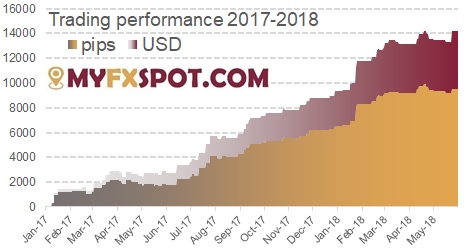
This is how MyFXspot.com trades now:
Trading strategy: Sell Open: 1.1645
Target: -
Stop-loss: 1.1715
Recommended size: 2.86 mini lots per $10,000 in your account
Short analysis: Bullish pressure continues to build for an assault on the 1.1629/1.1660 key Fibos, which are 38.2/50% retraces of the 1.1790 to 1.1530 (July to August) fall. Bias also intact for the daily cloud base in between the Fibos at 1.1653. We are looking to fade the recovery at 1.1645 in anticipation for a bearish resumption in the days ahead.
Trading strategy: Sell
Open: 1.2960
Target: -
Stop-loss: 1.3110
Recommended size: 1.33 mini lots per $10,000 in your account
Short analysis: GBP/USD bears look on course to register a weekly close below the major 1.2934 Fibonacci level, a 50% retrace of the 1.1491 to 1.4377 (2016 to 2018) rise. There are near-term risks of a recovery due the the oversold market, but gains will likely be limited by Wednesday's 1.2960 high.
Trading strategy: Sell
Open: 111.40
Target: -
Stop-loss: 112.40
Recommended size: 1.66 mini lots per $10,000 in your account
Short analysis: Tenkan and kijun are negatively aligned, reinforcing overall bearish bias. Bears had been taking control bulls faltered ahead of the key 112.19 Fibo, a 61.8% retrace of the 113.18 to 110.58 fall. To take advantage of recovery moves we have lowered our offer to 111.40, which is ahead of the daily tenkan line at 111.43.
USD/CAD
Trading strategy: Short
Open: 1.3050
Target: 1.2850
Stop-loss: 1.3050 (lowered from 1.3150)
Recommended size: 1.96 mini lots per $10,000 in your account
Short analysis: USD/CAD reversed early gains above 1.3100. After seven attempts below 1.3000, pair rallied above 10-DMA (1.3028) giving momentum to bulls. We have lowered the stop-loss to 1.3050 to make the trade risk free.
Trading strategy: Await signal
Open: -
Target: -
Stop-loss: -
Recommended size: -
Short analysis: Short-term rally stalls by the daily cloud base and ahead of the 55-DMA. The long lower wick on the monthly candle gives a bullish tint. Consolidation of long-term losses suggests a break lower is due. Signals are a bit mixed so we closed our long position and will stand aside for now.
Trading strategy: Short
Open: 0.9010
Target: 0.8910
Stop-loss: 0.9060
Recommended size: 3.11 mini lots per $10,000 in your account
Short analysis: Trading above the upper bolli-band now at 0.8986 signals an overbought market. We have gone short at 0.9010.
Trading ideas by MyFXspot.com
