Macroeconomic overview
Donald Trump is now the 45th President of the United States. Investors had been looking to Trump's first address as president to highlight his plans for fiscal spending, tax cuts and regulatory reforms. Instead, Trump focused his remarks on his "America first" policies that were short on specific proposals.
The ultimate target of his policy is,
to create 25 million new American jobs in the next decade and return to 4% annual growth.
To get there, the president proposes: 1. a tax reform, which simplifies the tax code, and lowers rates for corporates and individuals in every tax bracket. 2. A moratorium on new federal regulations, as well as the identification (and ultimately the repeal) of job-killing regulations. 3. The withdrawal from or renegotiation of trade deals.
The dollar edged down on Friday, pretty in line with our expectations, as investors were underwhelmed by the limited scope of executive actions and the lack of concrete policy reforms in the inauguration speech of newly sworn-in U.S. President Donald Trump.
Technical analysis
The EUR/USD rises today and is still above 7-day exponential moving average, which strengthens our bullish view in the short term. An important resistance level is at 1.0817 (50% fibo of November-January fall). 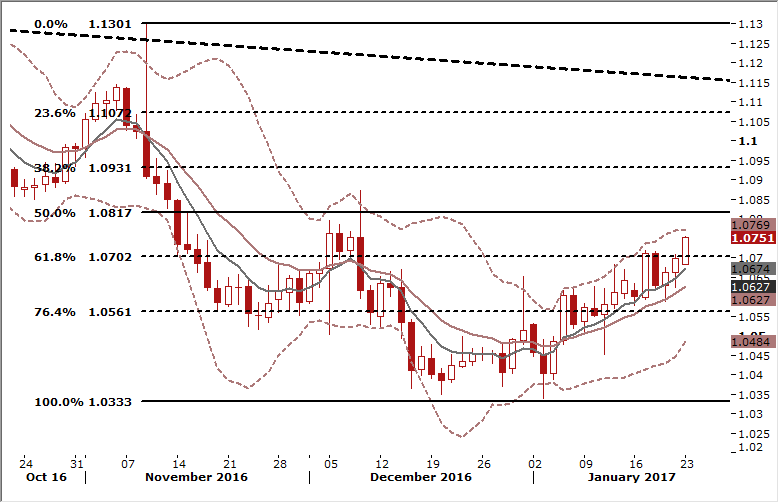
Yield spread between German and U.S. 10-year bonds 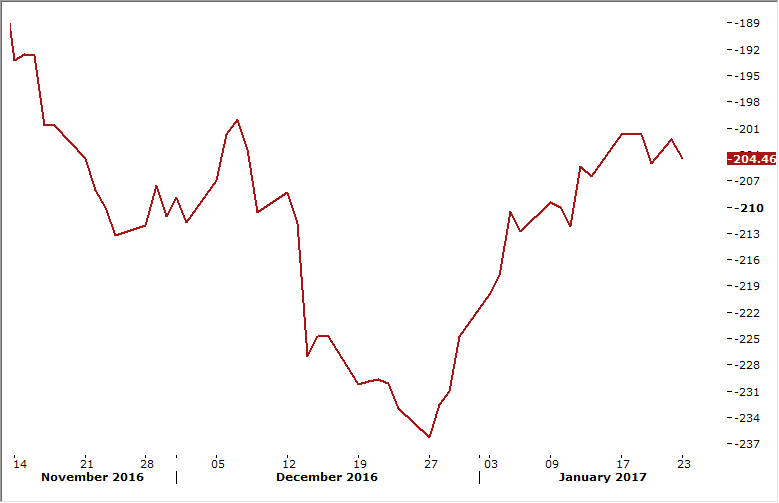
Trading strategy
We have raised the target of our long position to 1.0810.
USD/CAD: Doji candlestick on Friday suggests return to downward move
Macroeconomic overview
Canadian inflation rate rose to 1.5% from November's 1.2%, below market forecasts for an increase to 1.7%. Gasoline prices jumped 5.5% compared to the year before. But annual food prices fell for the third month in a row and were down 1.3% in December as Canadians paid less for fresh fruit and vegetables.
Two of the three new measures of core inflation the Bank of Canada established late last year showed underlying inflation was closer to the central bank's 2% target.
CPI median, which shows the median inflation rate across CPI components, held at 2.0% after the previous month was revised up, while CPI trim, which excludes upside and downside outliers, was also steady at 1.6%.
But CPI common, which the central bank has said has the best correlation to the output gap, was furthest away from target, edging up to 1.4% from 1.3%. Common measures price changes across categories in the CPI basket.
Canadian retail sales rose 0.2% in November vs. market expectations for an increase of 0.5%. Excluding vehicles, retail sales were up just 0.1%. Stores normally associated with Black Friday sales saw mixed results. Purchases at electronics and appliance stores were up 1.0%, but sales at sporting goods and hobby stores declined 0.3% and clothing stores were up just 0.1%.
The CAD pared earlier losses following weaker-than-expected inflation and retail sales data, to finish little changed against its U.S. counterpart on Friday. On Monday the USD/CAD falls on broad USD weakness.
Technical analysis
A doji candlestick on Friday suggests the end of USD/CAD recovery and a return to downward trend. In our opinion a fall to 1.3030 is the most likely scenario for the coming days. 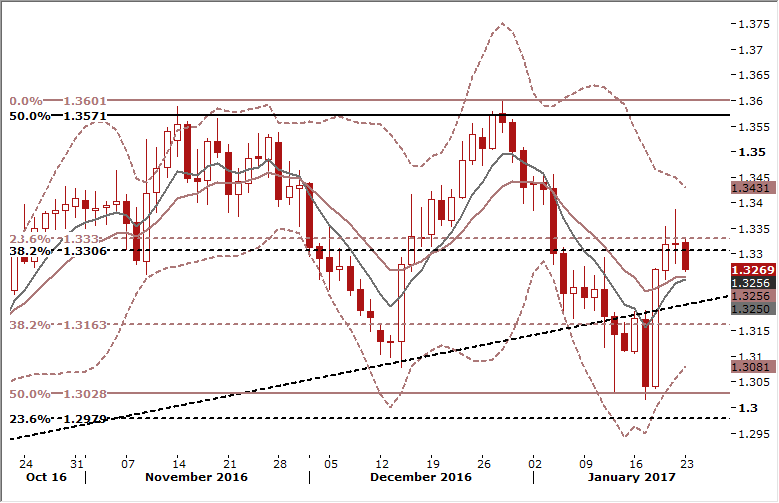
Yield spread between U.S. and Canadian 10-year bonds 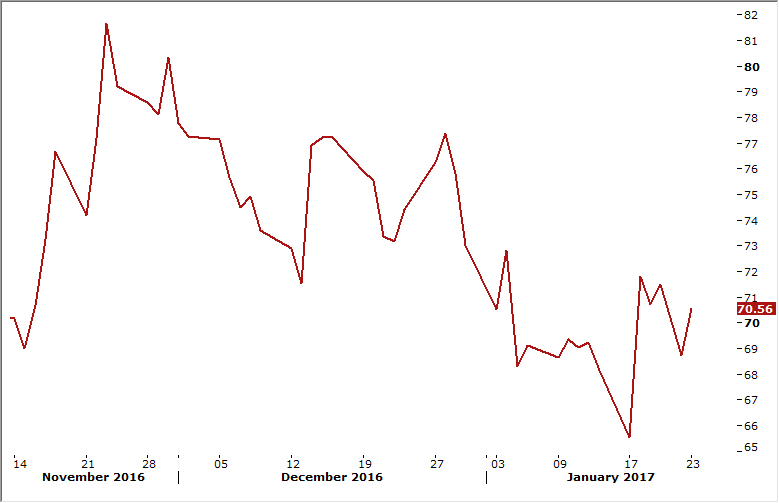
Trading strategy
We keep our short USD/CAD positions unchanged.
TRADING STRATEGIES SUMMARY:
FOREX - MAJOR PAIRS: 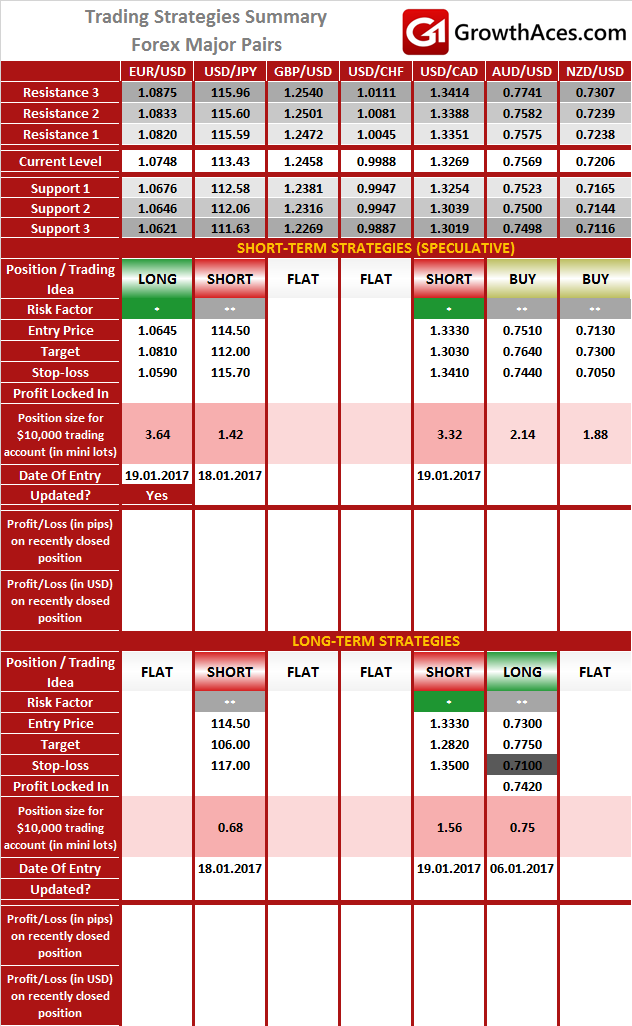
FOREX - MAJOR CROSSES: 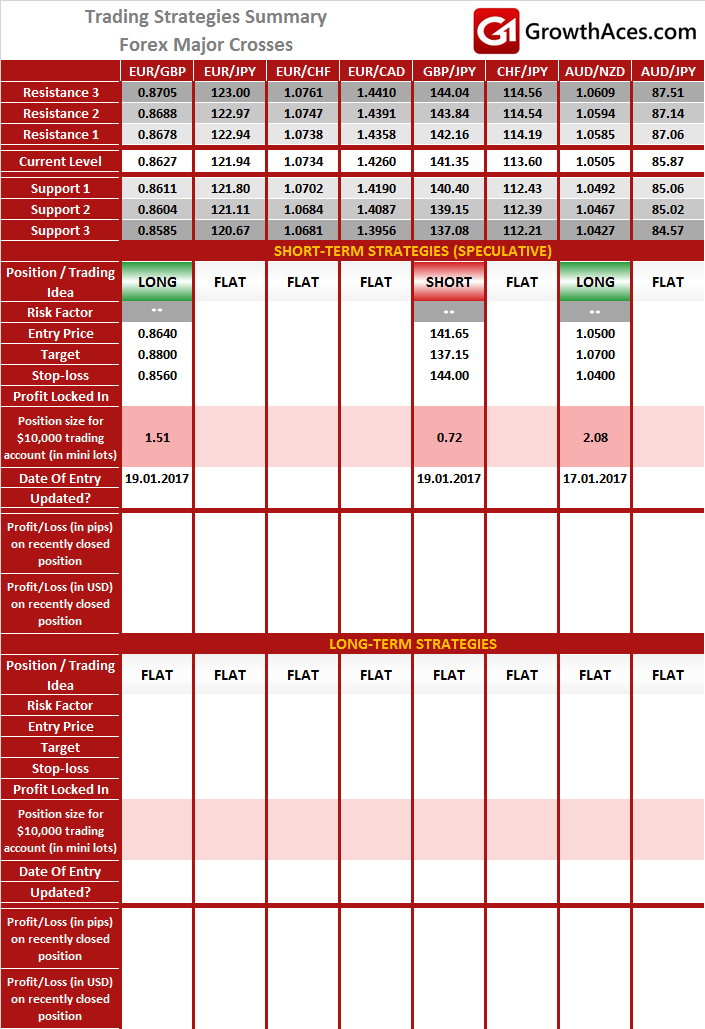
PRECIOUS METALS: 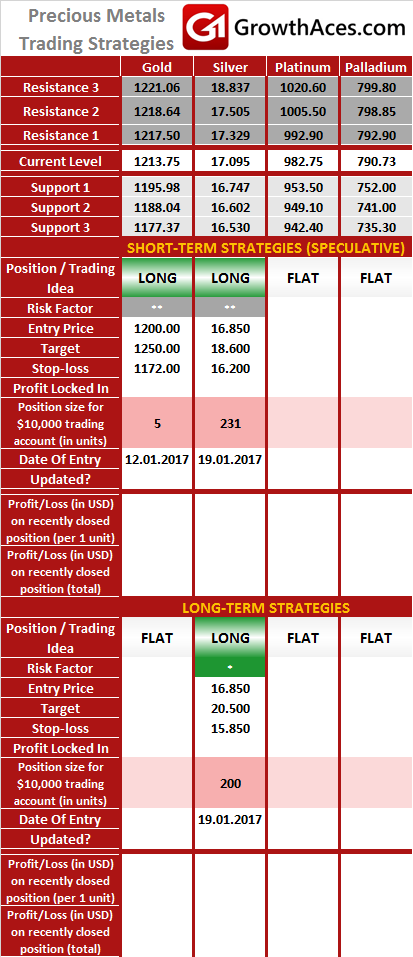
It is usually reasonable to divide your portfolio into two parts: the core investment part and the satellite speculative part. The core part is the one you would want to make profit with in the long term thanks to the long-term trend in price changes. Such an approach is a clear investment as you are bound to keep your position opened for a considerable amount of time in order to realize the profit. The speculative part is quite the contrary.
You would open a speculative position with short-term gains in your mind and with the awareness that even though potentially more profitable than investments, speculation is also way more risky. In typical circumstances investments should account for 60-90% of your portfolio, the rest being speculative positions. This way, you may enjoy a possibly higher rate of return than in the case of putting all of your money into investment positions and at the same time you may not have to be afraid of severe losses in the short-term.
How to read these tables?
1. Support/Resistance - three closest important support/resistance levels
2. Position/Trading Idea:
BUY/SELL - It means we are looking to open LONG/SHORT position at the Entry Price. If the order is filled we will set the suggested Target and Stop-loss level.
LONG/SHORT - It means we have already taken this position at the Entry Price and expect the rate to go up/down to the Target level.
3. Stop-Loss/Profit Locked In - Sometimes we move the stop-loss level above (in case of LONG) or below (in case of SHORT) the Entry price. This means that we have locked in profit on this position.
4. Risk Factor - green "*" means high level of confidence (low level of uncertainty), grey "**" means medium level of confidence, red "***" means low level of confidence (high level of uncertainty)
5. Position Size (forex)- position size suggested for a USD 10,000 trading account in mini lots. You can calculate your position size as follows: (your account size in USD / USD 10,000) * (our position size). You should always round the result down. For example, if the result was 2.671, your position size should be 2 mini lots. This would be a great tool for your risk management!
Position size (precious metals) - position size suggested for a USD 10,000 trading account in units. You can calculate your position size as follows: (your account size in USD / USD 10,000) * (our position size).
6. Profit/Loss on recently closed position (forex) - is the amount of pips we have earned/lost on recently closed position. The amount in USD is calculated on the assumption of suggested position size for USD 10,000 trading account.
Profit/Loss on recently closed position (precious metals) - is profit/loss we have earned/lost per unit on recently closed position. The amount in USD is calculated on the assumption of suggested position size for USD 10,000 trading account.
