Get 40% Off
🚨 Volatile Markets? Find Hidden Gems for Serious OutperformanceFind Stocks Now

EUR/USD: High Bull Flag Forming

Published 06/19/2020, 10:17 AM
Updated 07/09/2023, 06:31 AM

The EUR/USD so far today has a bull body on the daily chart. There are 2 small legs down from the June 10 top of a strong rally. The bulls hope that today will close near its high. Today would then be a High 2 bull flag buy signal bar for Monday.

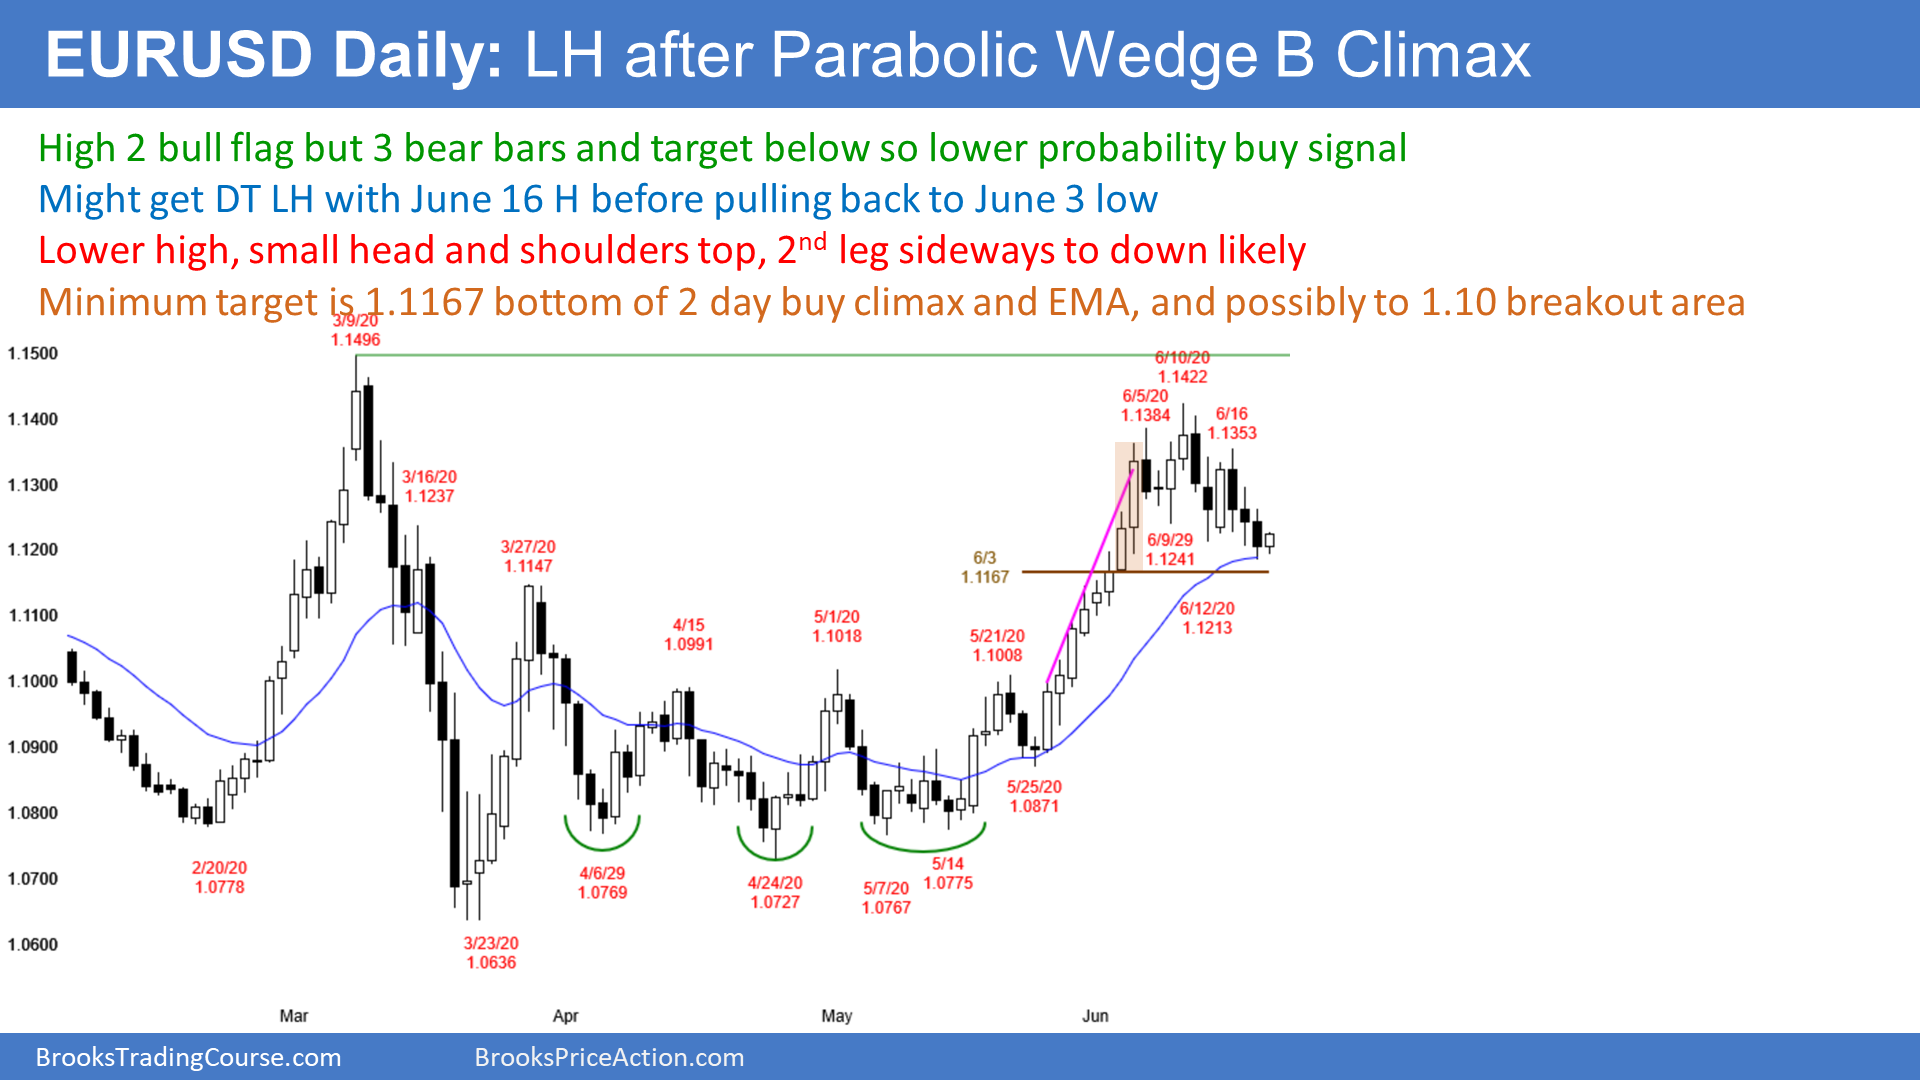
However, when there is a reversal from a buy climax, the selloff typically reaches the bottom of the most recent buy climax. That is the June 3 low. Therefore, if there is a rally next week, it will probably fail around the June 16 high.

There would then be a small double top forming on the chart at a lower high. Traders would then conclude that the 2 legs down to yesterday’s low was a complex 1st leg down. They would then look for a 2nd leg down from that small double top.

What would make traders conclude that yesterday was the end of the 2 legs down and that the bull trend was resuming? A breakout above the June high would do it. Also, for many traders, a rally that went 20 or 30 pips above the June 16 lower high would be enough.


On The 5-Minute Chart

The 5 minute chart shows the EUR/USD has rallied over the past hour. While today could continue up, all the bulls need is to close near the high. That would then create a good buy signal bar on the daily chart. Next week would then probably trigger the buy signal. Traders would then look for a test of the June 16 high.

3rd party Ad. Not an offer or recommendation by Investing.com. See disclosure here or remove ads .

Can today reverse back down? The rally is strong and the context is good for the bulls. Today should see the pair either work higher or enter a trading range.

This will make it difficult for the bears to make much money. Day traders are buying. If the rally evolves into a trading range, day traders will switch to buying pullbacks and looking for scalps. Also, the bears will then sell reversals down from scalps.

Latest comments

how to identify when to buy and when to sell
Buy around 1.10 or sell around 1.14.Do not enter market now.
Risk Disclosure: Trading in financial instruments and/or cryptocurrencies involves high risks including the risk of losing some, or all, of your investment amount, and may not be suitable for all investors. Prices of cryptocurrencies are extremely volatile and may be affected by external factors such as financial, regulatory or political events. Trading on margin increases the financial risks.
Before deciding to trade in financial instrument or cryptocurrencies you should be fully informed of the risks and costs associated with trading the financial markets, carefully consider your investment objectives, level of experience, and risk appetite, and seek professional advice where needed.
Fusion Media would like to remind you that the data contained in this website is not necessarily real-time nor accurate. The data and prices on the website are not necessarily provided by any market or exchange, but may be provided by market makers, and so prices may not be accurate and may differ from the actual price at any given market, meaning prices are indicative and not appropriate for trading purposes. Fusion Media and any provider of the data contained in this website will not accept liability for any loss or damage as a result of your trading, or your reliance on the information contained within this website.
It is prohibited to use, store, reproduce, display, modify, transmit or distribute the data contained in this website without the explicit prior written permission of Fusion Media and/or the data provider. All intellectual property rights are reserved by the providers and/or the exchange providing the data contained in this website.
Fusion Media may be compensated by the advertisers that appear on the website, based on your interaction with the advertisements or advertisers.
© 2007-2024 - Fusion Media Limited. All Rights Reserved.