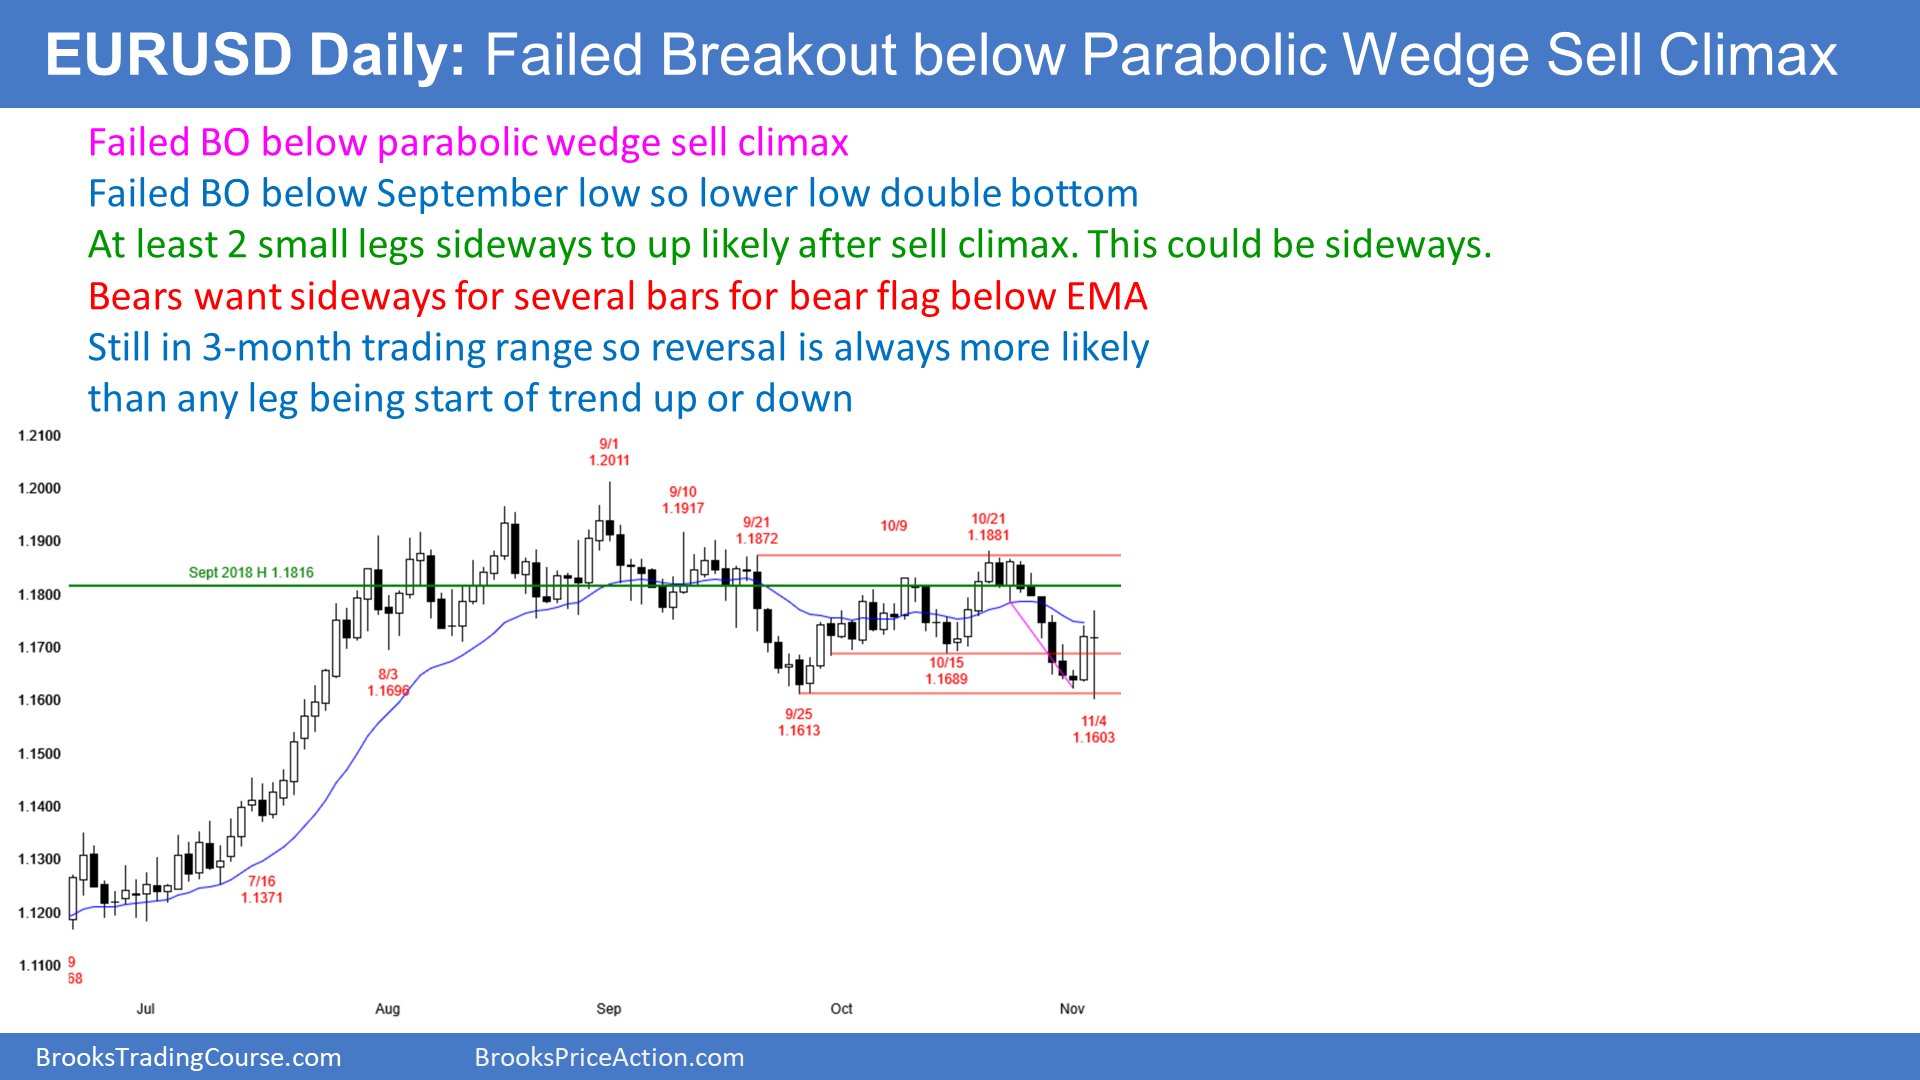
The EUR/USD forex market on the daily chart is forming a big doji bar so far today. Today traded above and below yesterday’s range and is therefore an outside bar.
More importantly, it reversed up from below a 2-week parabolic wedge bottom and from below the September low. Traders see this as a potential failed bear breakout.

If today closes near the middle of the day’s range or near the high, traders will expect a couple legs sideways to up. If the EUR/USD starts to break above the EMA, traders will expect a rally. The minimum goal would be a test of the October 21 lower high.
But if the EUR/USD goes sideways and is unable to break above the EMA, the bears will try again to break below the September low. The sideways trading will be a bear flag.
At the moment, traders need more information. They therefore expect sideways trading at least through tomorrow.
Will the EUR/USD form some bull days and get above the EMA? Traders would then look for higher prices.
Or, will the EUR/USD stay sideways for several days and have several bear bodies? Then traders will expect another bear breakout attempt and a move down to the March high, just below 1.15.
Overnight EUR/USD Forex trading
The 5-minute chart of the EUR/USD Forex market has a big range today. It reversed down from above yesterday’s high and then up from below yesterday’s low. It is therefore an outside day on the daily chart.
It is now trading around the open of the day. That makes the day a doji bar on the daily chart, which is neutral.
Big, Up, Big Down, Big Up creates Big Confusion. Confusion is a hallmark of a trading range. Consequently, there is an increased chance of trading range trading for the remainder of the day. Traders will look for reversals up and buy for 10 to 20-pip scalps. They will also sell reversals down for scalps.
Can today enter a sustained trend up or down for the remainder of the session? It probably will not. With today now being a big outside doji bar on the daily chart, it is telling us that traders are exhausted. They will therefore not want to exert themselves again today. Today will probably go sideways around the open and close near the open.
But that can always change. If the chart begins to form a series of strong bull or bear bars, traders will switch to swing trading. Sideways is more likely.
