Get 40% Off
⚠ Earnings Alert! Which stocks are poised to surge?
See the stocks on our ProPicks radar. These strategies gained 19.7% year-to-date.
Unlock full list

EUR/USD And GBP/JPY Analysis – March 13, 2018

Published 03/13/2018, 06:15 AM
Updated 03/21/2024, 07:45 AM

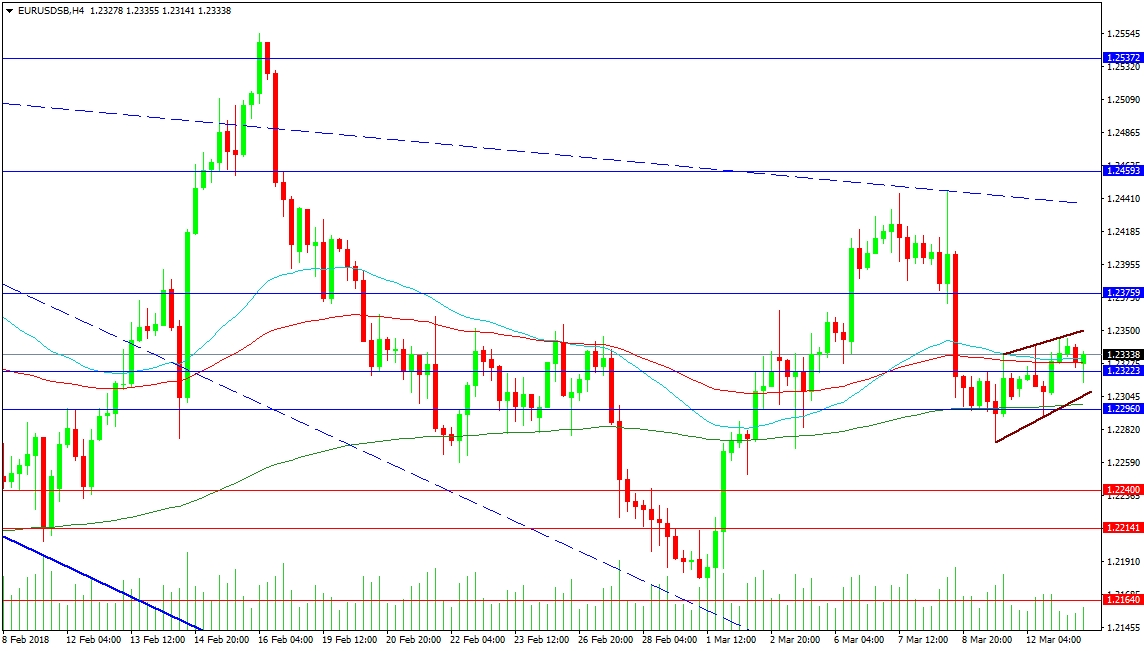
The EUR/USD pair has managed to find support and resistance at previously broken trend lines and has pulled back to the 1.23000 level, forming what looks to be wedge across it. This can happen around important levels as sellers and buyers battle for control. The wedge can be a continuation pattern but can also cause a reversal. Until price breaks the pattern and points out its intentions patience is required to avoid being caught in a position against the move. US Consumer Price Index data later today, at 12:30 GMT, is a possible trigger for a breakout. The resistance trend line is found at 1.23492 currently, with the 1.23759 level beyond. The previously broken trend line is found at 1.24380, with the 1.24593 level above. Recent highs are found at 1.25549.

Support is found at the pattern bottom (1.23037). On the 4-Hour chart, the moving averages are quite flat, suggesting that price is building energy for a break out at some point in the future. The 200-period MA is at 1.22993, with the 1.22960 level close by. Further support is found at 1.22400 and 1.22141, with the 1.21640 beyond.

EUR/USD 4-Hour Chart

GBP/JPY

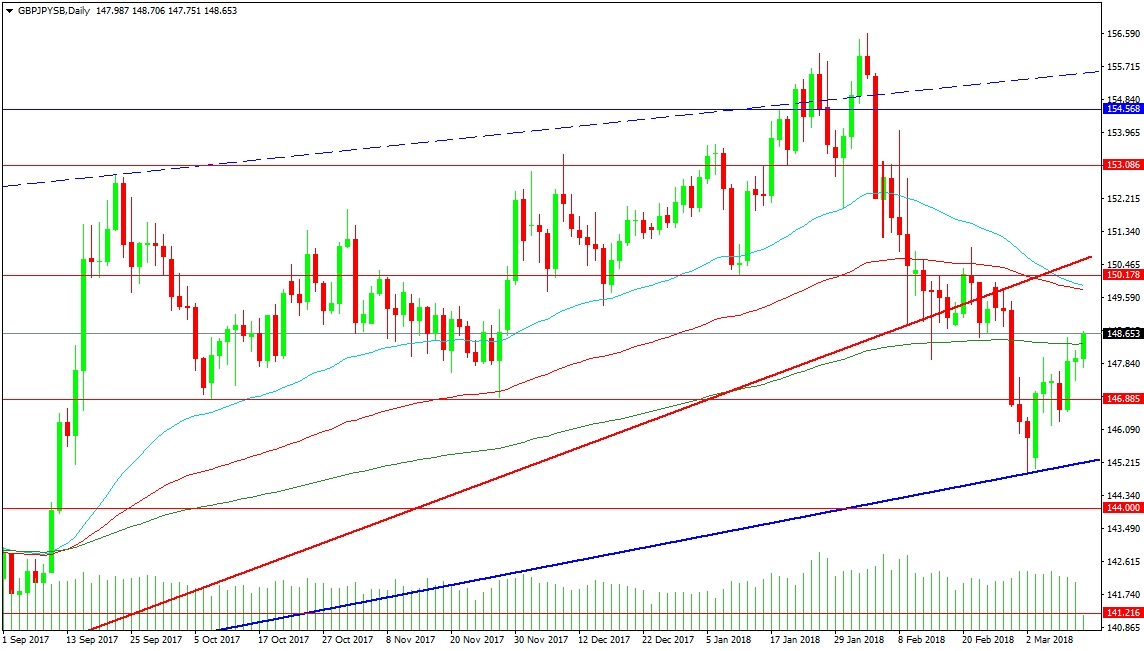
This pair is moving higher after finding support at the rising blue trend line at 144.842. Support can be seen at the 200 DMA at 148.365, with 146.885 below. The supportive trend line is found at 145.213, with the 144.000 area underneath. A drop below this area would see price move towards 141.216.

Resistance at the 50 and 100 DMAs is found around 149.816 on the daily chart. The 150.178 level is reinforcing the rising red trend line at 150.537. The next key resistance level comes at 153.000, with 154.568 on the way to the broken trend line at 155.500. The 2018 highs are located at 156.597.

GBP/JPY Daily Chart

Latest comments

Risk Disclosure: Trading in financial instruments and/or cryptocurrencies involves high risks including the risk of losing some, or all, of your investment amount, and may not be suitable for all investors. Prices of cryptocurrencies are extremely volatile and may be affected by external factors such as financial, regulatory or political events. Trading on margin increases the financial risks.
Before deciding to trade in financial instrument or cryptocurrencies you should be fully informed of the risks and costs associated with trading the financial markets, carefully consider your investment objectives, level of experience, and risk appetite, and seek professional advice where needed.
Fusion Media would like to remind you that the data contained in this website is not necessarily real-time nor accurate. The data and prices on the website are not necessarily provided by any market or exchange, but may be provided by market makers, and so prices may not be accurate and may differ from the actual price at any given market, meaning prices are indicative and not appropriate for trading purposes. Fusion Media and any provider of the data contained in this website will not accept liability for any loss or damage as a result of your trading, or your reliance on the information contained within this website.
It is prohibited to use, store, reproduce, display, modify, transmit or distribute the data contained in this website without the explicit prior written permission of Fusion Media and/or the data provider. All intellectual property rights are reserved by the providers and/or the exchange providing the data contained in this website.
Fusion Media may be compensated by the advertisers that appear on the website, based on your interaction with the advertisements or advertisers.
© 2007-2024 - Fusion Media Limited. All Rights Reserved.