Get 40% Off
🚨 Volatile Markets? Find Hidden Gems for Serious OutperformanceFind Stocks Now

EUR/SEK Rebounds From Near 10.410, But Stays Below Two Diagonal Lines

Published 06/06/2022, 07:29 AM
Updated 07/09/2023, 06:31 AM

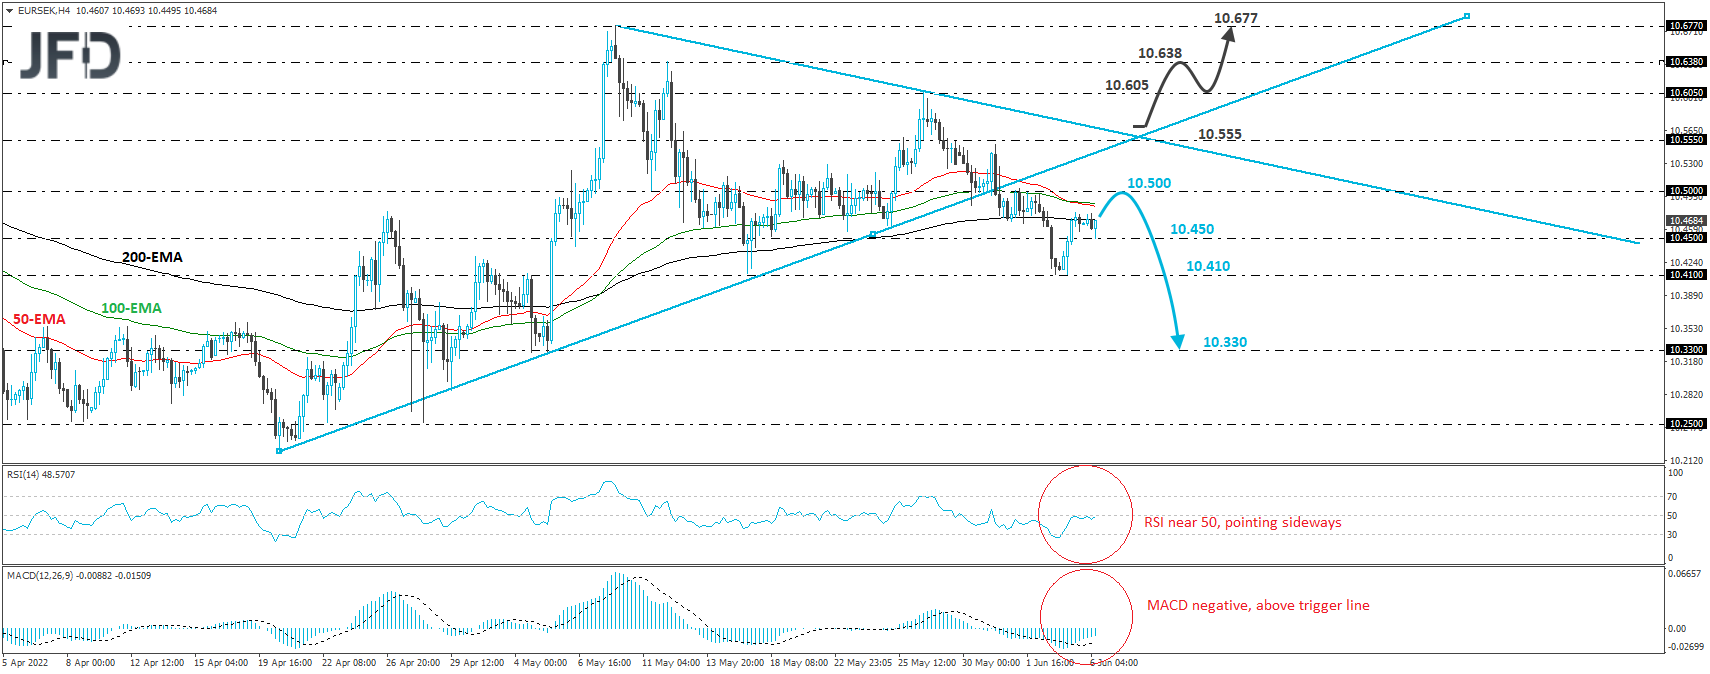
EUR/SEK traded higher on Friday, after hitting support at 10.410. That said, today, the rate traded in a quieter manner, staying slightly above the 10.450 zone, but well below the downside resistance line taken from the high of May 10, and well below the prior upside support line drawn from the low of Apr. 20.

In our view, this leaves the door open for the bears to jump back into the action and push the rate back down.

They may decide to take charge from near the 10.500 area, which provided resistance on June 1 and 2, and perhaps aim for another test near the 10.410 zone, which was hit on Friday, but also on May 17.

A break below that barrier will confirm a forthcoming lower low and could carry larger bearish implications, perhaps paving the way towards the 10.330 territory, defined as a support by the lows of May 4 and 5.

Taking a look at our short-term oscillators, we see that the RSI lies flat, fractionally below its 50 line, while the MACD, although negative, runs above its trigger line and points up.

Both indicators detect slowing downside speed, which means that some further consolidation, or even recovery, could be possible, perhaps until the 10.500 zone, which we already mentioned.

On the upside, we would like to see the recovery extending above both the aforementioned diagonal lines, as well as above the 10.555 territory. In our view, this could signal that the bulls have gained full control and that there are decent chances for more advances.

3rd party Ad. Not an offer or recommendation by Investing.com. See disclosure here or remove ads .

The next stop could be at 10.605, a resistance marked by the high of May 26, the break of which could aim for the high of May 12, at 10.638. If they don’t stop there, then we may see them climbing towards the high of May 10, at 10.677.
EUR/JPY 4-hour chart technical analysis

Latest comments

Risk Disclosure: Trading in financial instruments and/or cryptocurrencies involves high risks including the risk of losing some, or all, of your investment amount, and may not be suitable for all investors. Prices of cryptocurrencies are extremely volatile and may be affected by external factors such as financial, regulatory or political events. Trading on margin increases the financial risks.
Before deciding to trade in financial instrument or cryptocurrencies you should be fully informed of the risks and costs associated with trading the financial markets, carefully consider your investment objectives, level of experience, and risk appetite, and seek professional advice where needed.
Fusion Media would like to remind you that the data contained in this website is not necessarily real-time nor accurate. The data and prices on the website are not necessarily provided by any market or exchange, but may be provided by market makers, and so prices may not be accurate and may differ from the actual price at any given market, meaning prices are indicative and not appropriate for trading purposes. Fusion Media and any provider of the data contained in this website will not accept liability for any loss or damage as a result of your trading, or your reliance on the information contained within this website.
It is prohibited to use, store, reproduce, display, modify, transmit or distribute the data contained in this website without the explicit prior written permission of Fusion Media and/or the data provider. All intellectual property rights are reserved by the providers and/or the exchange providing the data contained in this website.
Fusion Media may be compensated by the advertisers that appear on the website, based on your interaction with the advertisements or advertisers.
© 2007-2024 - Fusion Media Limited. All Rights Reserved.