
The US dollar continued to strengthen against most of the other major currencies, but most equities drifted higher. That said, we prefer to maintain a cautious stance ahead of Friday’s US employment report. As for today, the main events on the agenda are the ADP private report and Eurozone’s preliminary CPIs, both for June.
US Dollar Gains Further, But S&P And NASDAQ Hit Fresh Records
The US dollar continued trading higher against all but one of the other major currencies. It gained the most ground versus NZD, CAD, and AUD in that order, while it lost some ground only versus JPY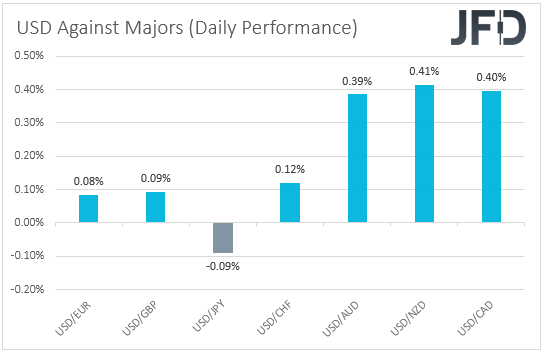
The strengthening of the US dollar and the Japanese yen, combined with the weakening of the risk-linked Aussie, Kiwi and Loonie, suggests that markets continued trading in a risk-off fashion yesterday and today in Asia. However, looking at the performance of major global stock indices, we see that this was not the case.
EU shares were a sea of green, with only Spain’s IBEX 35 closing nearly unchanged. In the US, both the Dow Jones and the S&P 500 finished fractionally above their openings, but this was after the S&P 500 hit a fresh record high. A fresh record was hit by NASDAQ as well, which gained 0.19% during Wall Street’s activity. As for today in Asia, sentiment was softer. Although China’s Shanghai Composite and South Korea’s KOSPI inched up, Japan’s Nikkei 225 and Hong Kong’s Hang Seng traded lower.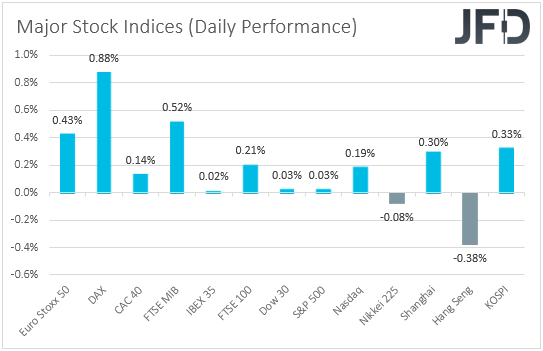
Market chatter suggests that the improvement in market sentiment during the European and US sessions may have been due to better-than-expected consumer sentiment data from both the Eurozone and the US. That may be the case, but with the US employment report ahead of us, we prefer to stick to our cautious stance, even as some equity indices continue to march to record highs. A strong employment report on Friday may add credence to the view that the world’s largest economy is growing at a fast pace, but accelerating wages may also mean that inflation could surge more, and may, after all, not be transitory. Something like that is likely to result in a stronger dollar, and perhaps cause equities to correct slightly lower.
As for today, we will get a first taste as to how the US labor market is performing from the ADP private employment report for June. The report is expected to show that the private sector has gained 600k jobs in June, less than the 978k added in May. This could raise some speculation that the NFPs, due out on Friday, may come near their own forecast of 675k. However, we will not rely much on the ADP report, as it’s been far from a reliable predictor of the NFPs. Even last month, when the ADP revealed a 978k job gain, the NFPs came in at 559k. It seems that market participants agree with us, and this is evident by how insignificant market reactions have been to the ADP number in the last years.
Ahead of the ADP, a more important data set is scheduled to be released and this is Eurozone’s preliminary CPIs for June. The headline CPI rate is expected to have ticked down to +1.9% yoy from +2.0% yoy, while the HICP excluding energy and food one is forecast to have held steady at +0.9% yoy. A small decline in the headline rate, and an underlying print still well below 2%, may add more credence to the view that ECB officials are unlikely to start considering withdrawing monetary policy support any time soon, and thereby support European equities. At the same time, the euro is likely to continue drifting south.
NASDAQ 100 Technical Outlook
The NASDAQ 100 cash index edged north yesterday, hitting a fresh record high, at around 14607. Overall, the index continues to print higher highs and higher lows above the upside support line drawn from the low of May 19, which, at least from a technical stand point, paints a positive picture.
We believe that investors may stay in the driver’s seat for a while more, at least until the release of the US employment report on Friday. As we already noted, a strong report may result a small setback, but if the index stays above the aforementioned upside line, we would expect it to rebound and continue conquering uncharted territories. We may initially see a test at 14700, the break of which could set the stage for the psychological round figure of 15000.
Now, in order to abandon the bullish case, we would like to see a dip below 14215. This may confirm a break below the upside line taken from the low of May 19, and could pave the way towards the 13990 zone, which provided support on June 21. If that zone doesn’t hold, then we could experience extensions towards the low of June 16, near 13850, or even the low of June 10, at around 13725.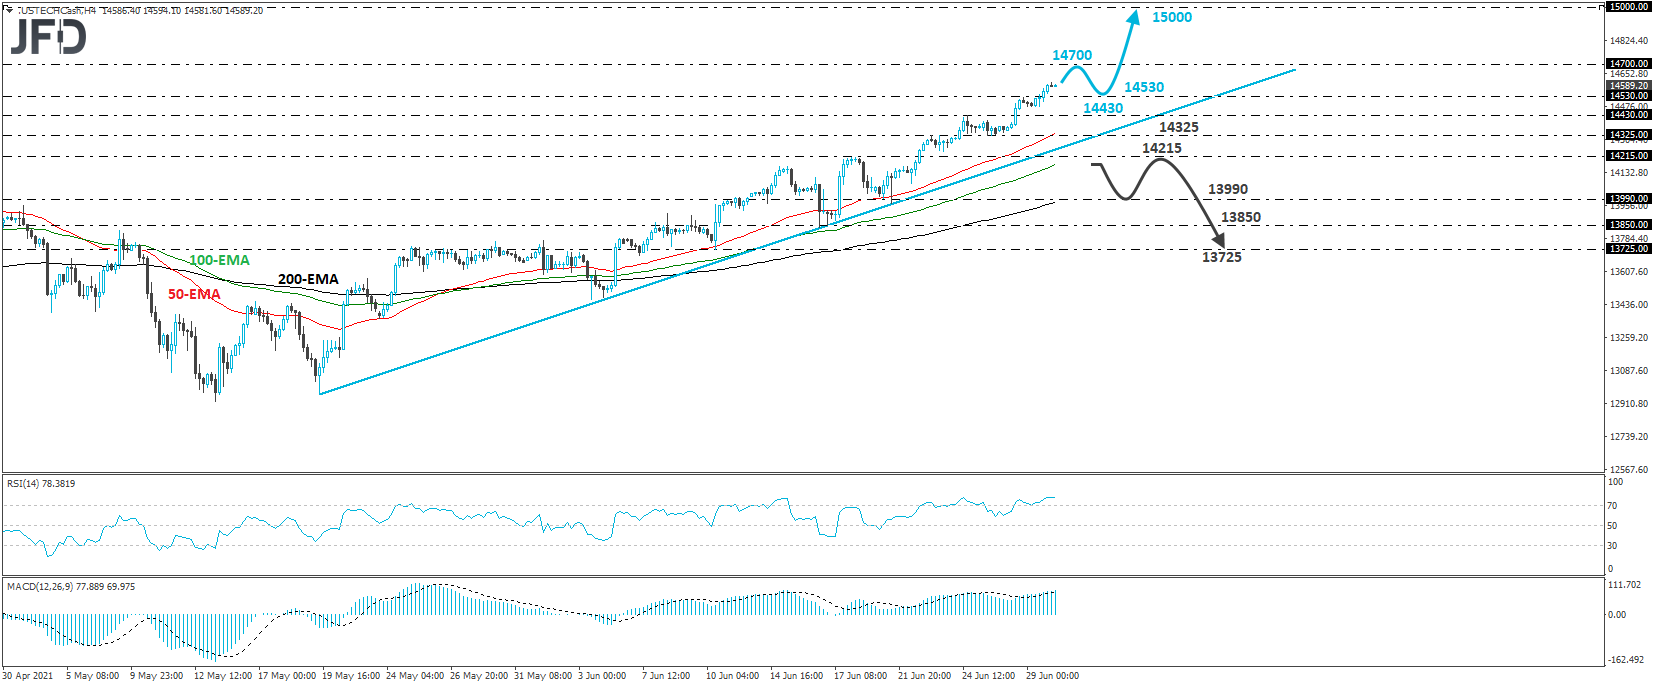
EUR/JPY Technical Outlook
EUR/JPY traded lower yesterday, but hit support at 131.28, and then it rebounded somewhat. The pair has been in a sliding mode since June 23rd, while trading below the downside resistance line taken from the high of June 15, and that’s why we will consider the short-term outlook to still be negative.
A clear break below 131.28 will confirm a forthcoming lower low on the 4-hour chart and may initially target an inside swing high formed on June 21, at 130.88. If that hurdle is not able to prevent further declines, its break may encourage the bears to target the low of that day, at around 130.05.
On the upside, we would like to see a break above 131.90 before we start examining the case of a decent positive correction. This would also take the rate above the aforementioned downside line and may open the path towards the 132.25 level, marked by an inside swing high formed on Monday. Another break, above 132.25 could extend the recovery towards the 132.45 level or the 132.67 barrier, which are marked by the highs of June 25 and 23 respectively. Slightly higher lies another downside resistance line, drawn from the high of June 1, which could also provide resistance.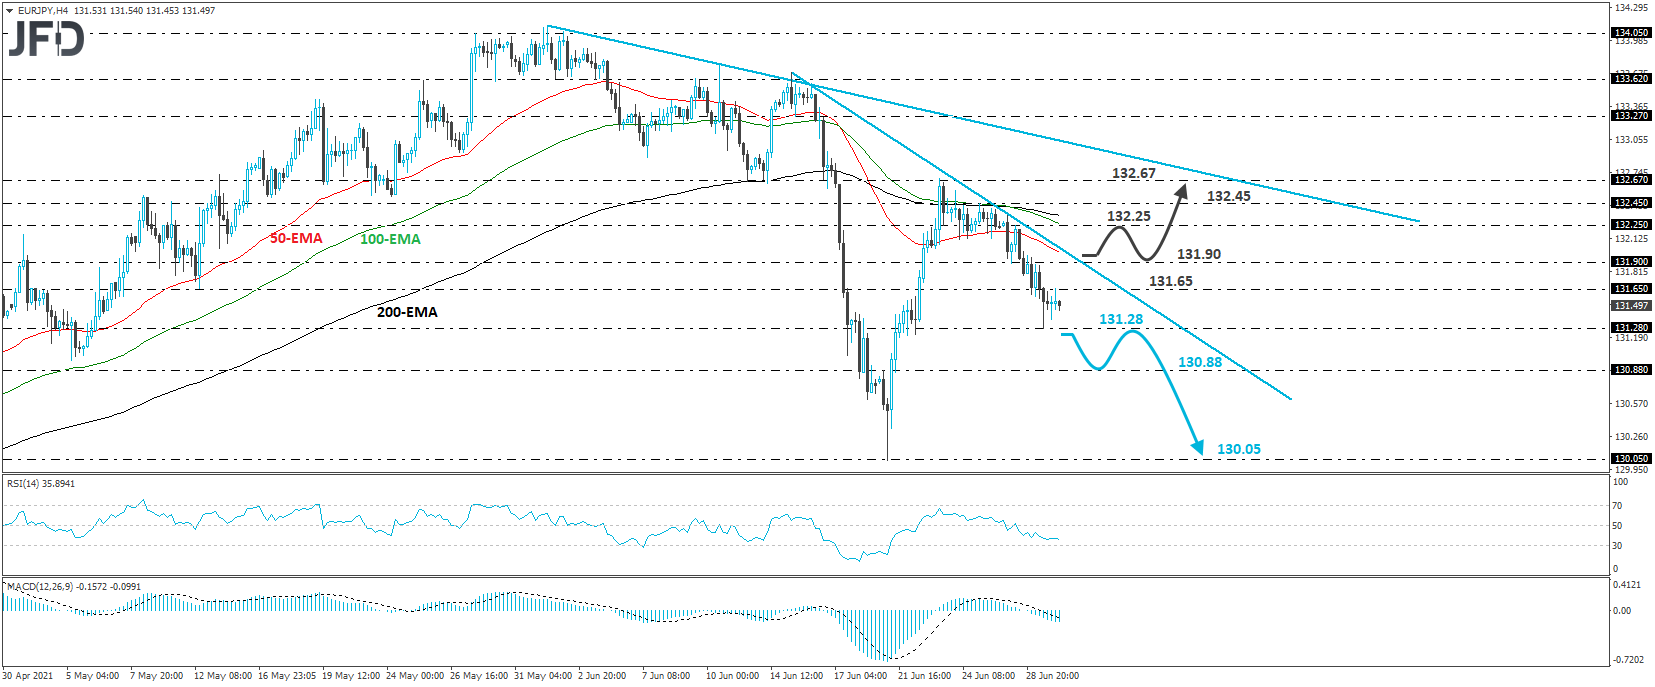
As For The Rest Of Today's Events
During the early EU session, we already got the UK’s final GDP for Q1, which was revised fractionally lower, to -1.6% qoq from -1.5%. In a while, ahead of the EZ CPIs, we will get the German unemployment rate for June, which is expected to have ticked down to 5.9% from 6.0%.
Later in the day, from the US, besides the ADP report, pending home sales for May are due to be released, and the forecast points to a 1.0% mom decline after a 4.4% tumble in April.
From Canada, we get the monthly GDP for April, which is expected to reveal a contraction of 0.9% mom after expanding 1.1% in March. However, we don’t believe that any potential slide in the Loonie due to that will be large and long-lasting. We believe that CAD-traders may pay more attention to the OPEC+ meeting scheduled for Thursday.
As for the speakers, we will get to hear from ECB Executive Board member Fabio Panetta, Atlanta Fed President Raphael Bostic, and Richmond Fed President Thomas Barkin.