A positive Asian session
Despite a hefty increase of coronavirus cases and deaths over the past 24 hours, investors are taking heart that all the increases are contained within mainland China, with the global spread at least slowing, even though one death was reported in Hong Kong.
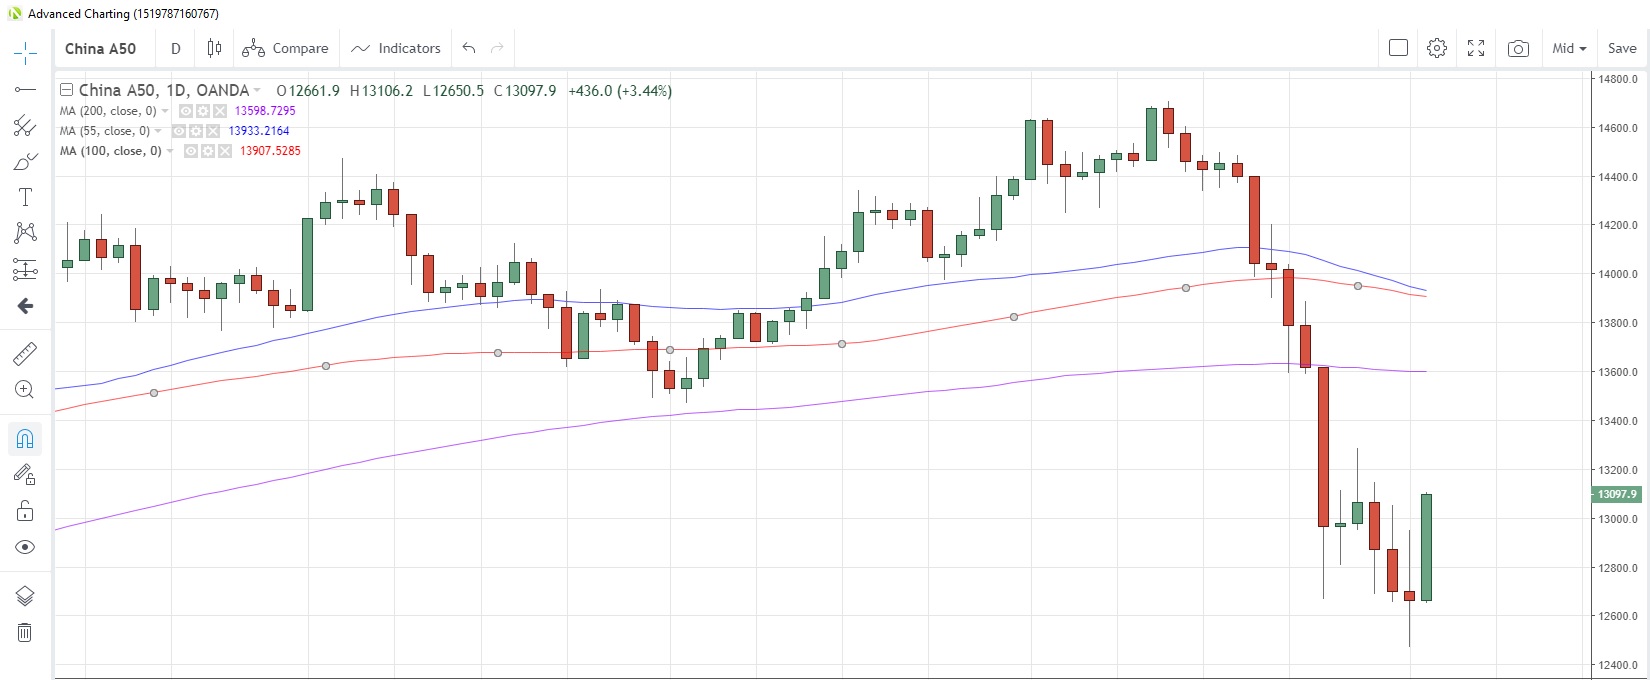
Equity markets were buoyant during this morning’s Asian session, also helped along by the liquidity boost Chinese authorities injected into local markets. The China50 index surged 3.2%, the biggest one-day gain since June 20, which snapped a three-day losing streak. US indices rose between 0.70% and 0.90%, with the NAS100 index out-performing.
CN50USD Daily Chart

Europe prepares for a higher open
Futures markets are pointing to a higher open in Europe, with the Germany30 index rising for a second consecutive day and the UK 100 index building on yesterday’s gains.
Both the euro and the pound have struggled the past two days as the US dollar regained some of its mojo on the back of slightly higher bond yields. US Treasuries have seen selling pressure as a modicum of risk appetite returned, with the 10-year US yield gaining 3 bps yesterday.
RBA holds rates
With a minority hoping that the Reserve Bank of Australia might cut rates when faced with the outbreak of the coronavirus (though Australia has only 12 confirmed cases – Source John Hopkins University), the unchanged announcement encouraged the Australian dollar, which rose 0.38% versus the US dollar and 0.54% versus the Japanese yen.
The statement accompanying the decision was generally more upbeat than expected, with a favourable outlook for unemployment and the housing market. With interest rates at low levels and the lag factor for transmission of prior rate cuts, the Bank deemed it prudent to leave rates unchanged. However, as always, the central bank said it was prepared to ease monetary policy further if it was needed to support growth in the broader economy.
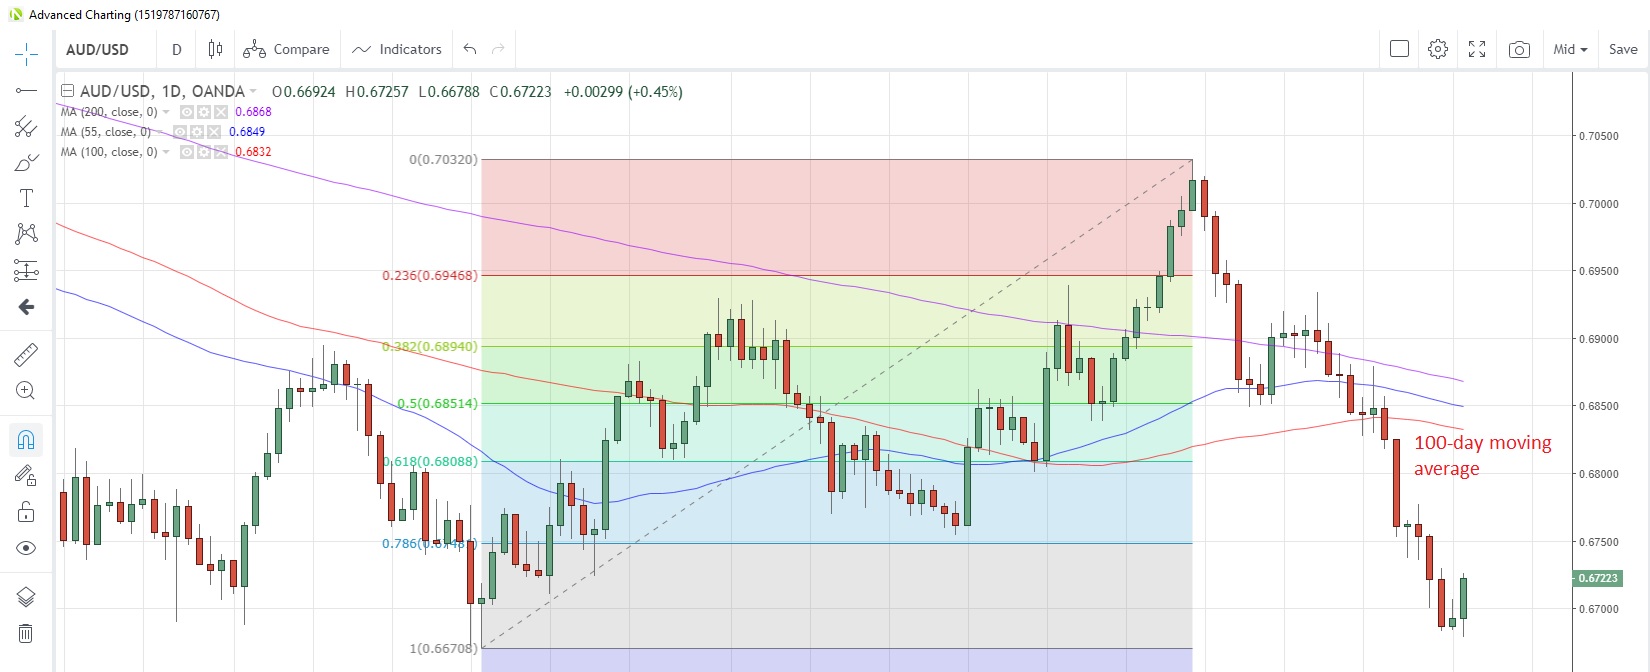
The AUD/USD jump was the biggest intra-day gain since January 10 with the 100-day moving average at 0.6832 the next possible technical resistance point.
AUD/USD Daily Chart

Data likely to be ignored
There’s not much to excite on the data front, with the European calendar only having UK construction PMI and Euro-zone producer prices on tap. Prior to that, we have Hong Kong retail sales for December, but that will only attract attention to see how bad it might be on the back of the protests. The latest survey suggests a 17.5% decline on top of November’s 23.6% drop.
The major event for the US session will be factory orders for December, which are seen rising 1.1% m/m, a smart turnaround from November’s 0.7% contraction.
