There is one variable that explains the euro movement better than any other single variable we have found. The US-Germany two-year interest rate differential continues to be highly correlated with the euro-dollar exchange rate.
Specifically, the percent change in the differential (or swap rate) and the percent change in the euro have a 0.56 correlation over the past 60 days. It is roughly the same over the past 30 sessions. Both are at near multi-year extremes. On a purely directional basis, the correlation is even greater (~0.66).
It makes sense then to look at the drivers of the interest rate differential to back into a view of the euro. The multi-year high was set shortly before the Fed hiked rates last month just shy of 223 bp. By the start of this week, it had fallen to 192 bp, almost a three-month low. It is now near 198 bp.

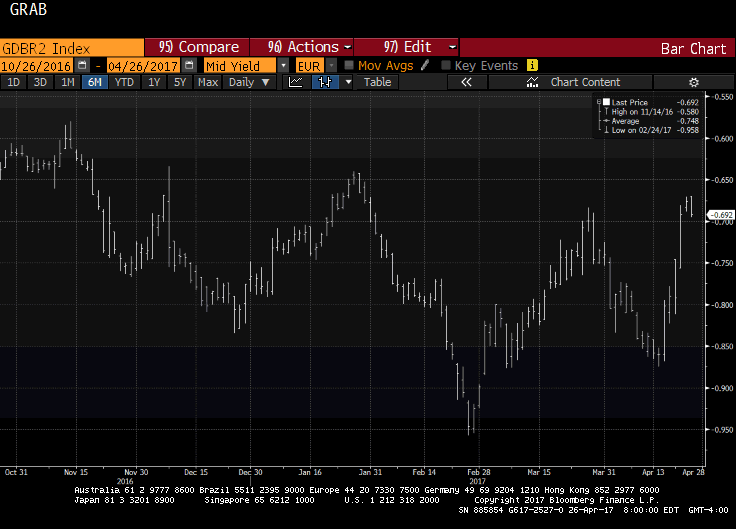
Let's look at the two components separately. The first chart (Bloomberg) shows the German two-year yield. The yield rose 20 bp since April 18. There seemed like a couple of drivers. First, half of the increase appears to be the unwinding of safe haven demand after the first round of the French presidential contest.
Second, there is much talk about the ECB changing its guidance or policies as growth seems solid. The German yield (minus ~70 bp) is near the upper end of its nearly five-month range. The momentum has waned. If the ECB does not tweak its securities lending program tomorrow, the rate is likely to fall back into deeper negative territory as the pressure spurred by the shortage of short-term German paper, (which the BBK appears to have been buying) that is used for collateral (as well as investment).

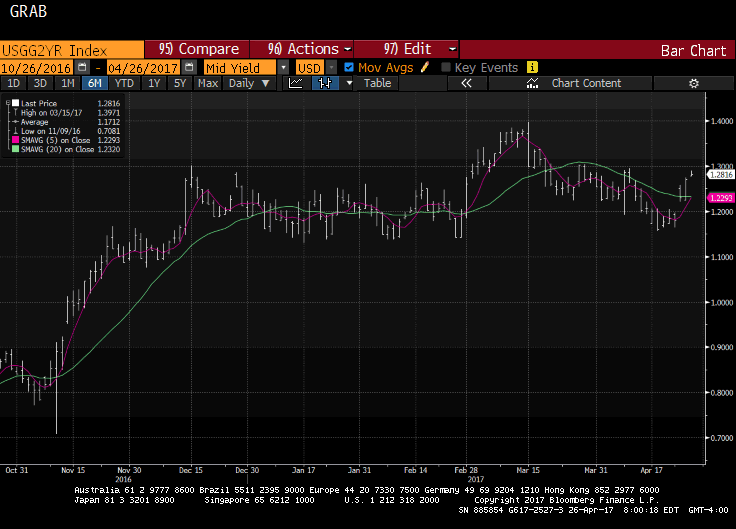
The other side of the spread is the US yield. Since the March 15 Fed hike, the two-year note yield fell from 1.40% to nearly 1.15%, where it bottomed last week. The pullback seemed to be largely a function of some profit-taking, disappointment that the Fed was not more hawkish, and some soft US data.
The yield is now at the upper end of where it has been over the past month, knocking on the 1.30% level. A move above there would lift the technical tone.
For good reason, no one expects the Fed to move next month, but the prospect of a June hike is increasing. Bloomberg's calculation puts the odds at 61%, and the CME says 67% chance. Apparently, the hawks at the ECB warn that the forward guidance can change in June. Even if it materializes, the Fed could be delivering its third hike since last November's election. Around the time, the ECB may announce that it will slow its asset purchases with an eye to wind down the program, the Fed may be starting to shrink its balance sheet.
Divergence continues.
