Selling flows hit the Euro as the market adjusts its view on the upcoming ECB QEII, while the USD keeps finding the backing of domestic economic data, not making the Fed's job any easier as trade tensions between the US-China remain elevated. The Aussie and the Pound ended as the top performers on upbeat Aus jobs and lower odds of hard Brexit.
The Daily Edge is authored by Ivan Delgado, Market Insights Commentator at Global Prime. The purpose of this content is to provide an assessment of the market conditions. The report takes an in-depth look of market dynamics, factoring in fundamentals, technicals, inter-market in order to determine daily biases and assist one’s decisions on a regular basis. Feel free to follow Ivan on Twitter & Youtube.
Quick Take
Two of the currencies most punished in recent times, the Aussie and the Pound, kept finding buying interest as the market adjusts expectations over the timing of the next RBA rate-cutting decision given the strong Aus jobs, while a no-deal Brexit is marginally priced out as labor leader Corbyn looks to join forces aiming for a no-confidence vote. In stark contrast, the market was alienated against the Euro this time, as ECB's Governing Council member Rehn hinted that an overshooting of the upcoming QE2 is preferable. On the contrary, the market kept finding solid reasons to keep a bid in the USD as domestic economic data dump out of the US came upbeat on aggregate. In an environment where the relentless sell-off in global bond yields simply doesn't abate, the Japanese Yen kept finding buyers while the Swissy appeared to be drag by the Euro this time, amid a better tone in the equity market in the US as the market corrects Wednesday's down day in the S&P 500, which was one of the sharpest falls this year. Lastly, the Canadian Dollar and the New Zealand Dollar remain technically bearish as the market now starts to suspect the BOC is the next CB to bite the bullet with a rate cut later this year.
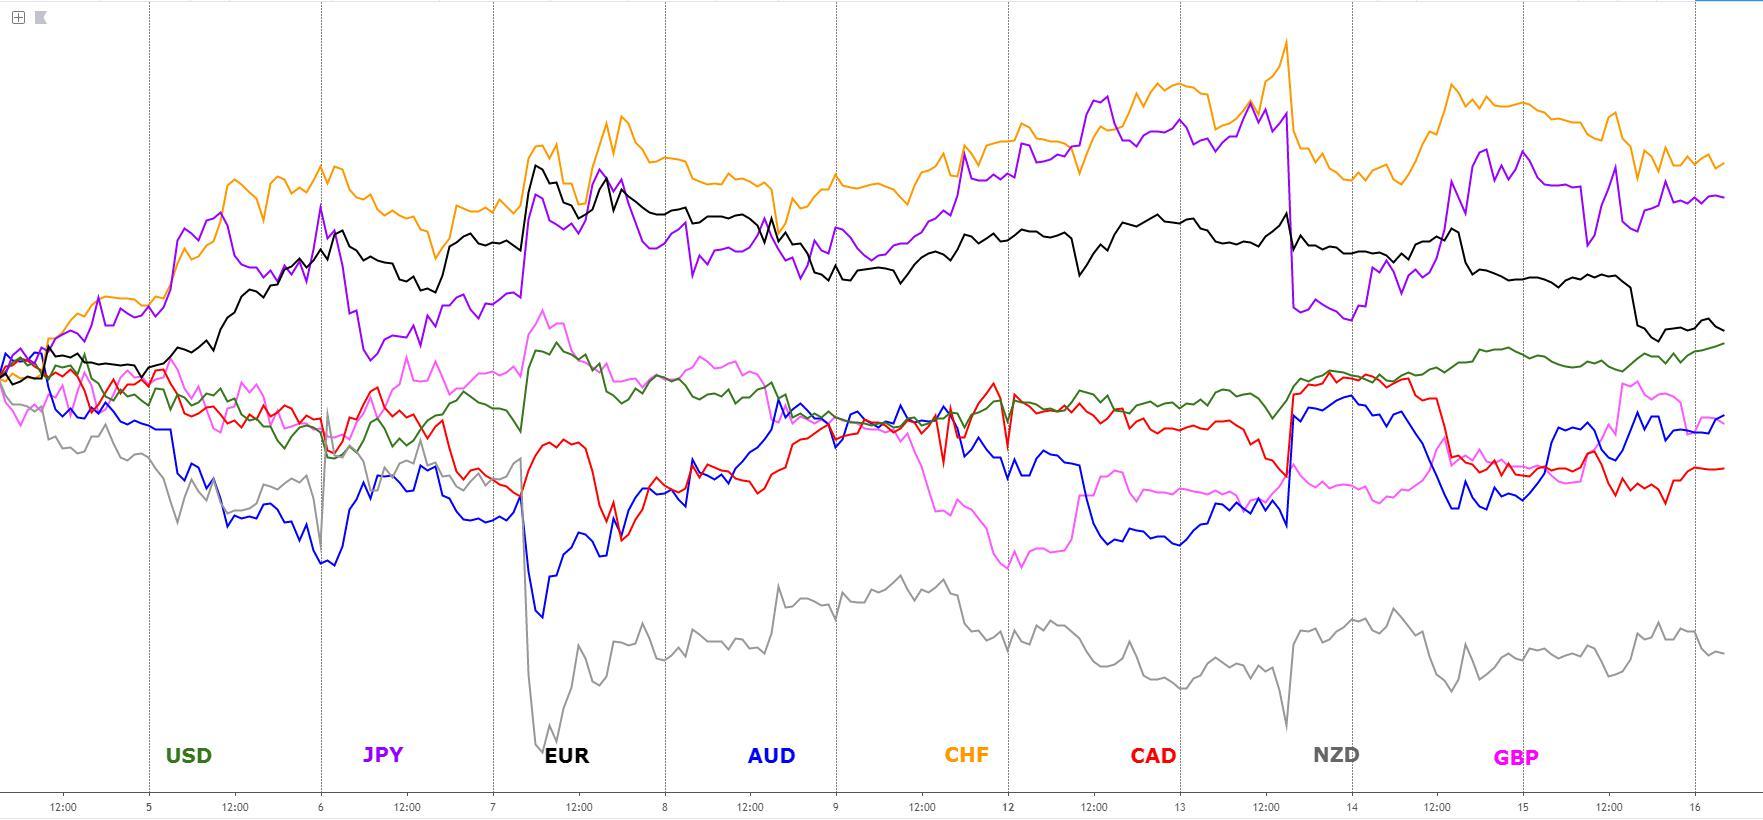
The indices show the performance of a particular currency vs G8 FX. An educational article about how to build your own currency meter can be found in the Global Prime's Research section.
Narratives In Financial Markets
* The Information is gathered after scanning top publications including the FT, WSJ, Reuters, Bloomberg, ForexLive, Institutional Bank Research reports.
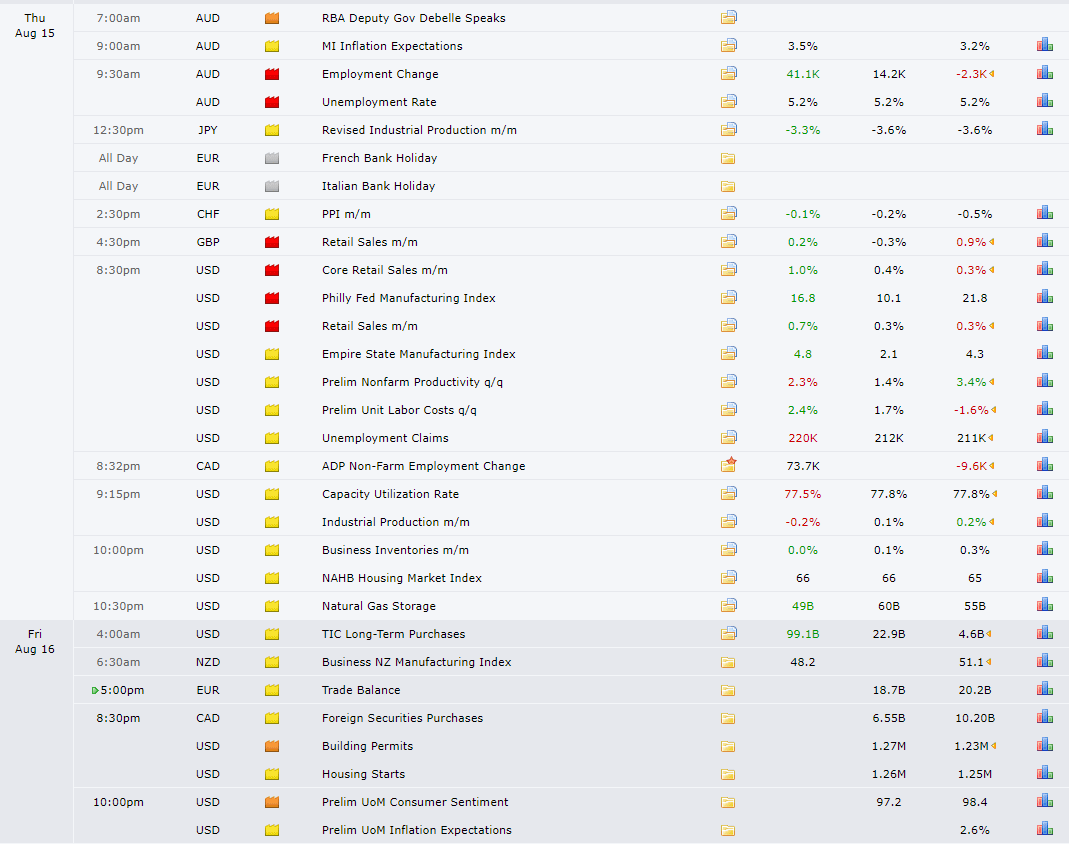
Odds of 50bp Fed cut rise despite upbeat US data: The raft of US economic data came, on aggregate, significantly better, but that didn’t matter as the sell-off in global yields remained relentless, with the US 30-year bond yield dropping to a fresh record low of 1.92%, the 10-year yield below 1.5%, while the Fedwatch tool indicates that the chances of a 50bp rate cut by the Fed in its Sept meeting have gone up to 32%. The US data included an upbeat read in retail sales, claims continued to show strength, the empire manufacturing, and Philly index came stronger, as did Q2 productivity. Industrial production was weaker, while the NAHB housing index and inventories were flat-lined.
ECB's Rehn raises prospect of aggressive QE: The extension of the bearish trend in bond yields came in response to ECB's member Rehn, who also acts as the Governor at the Bank of Finland, who via an interview with the WSJ, said it's better to overshoot on stimulus than undershoot. Rehn added that “it's important that we come up with a significant and impactful policy package in September.” The Euro was negatively impacted on the news as it heightens expectations that the ECB could announce a more aggressive-than-expected package of measures. After the news, the odds for a 20bp rate cut have gone up to over 50% as opposed to the 10-bps move initially thought.
USD strength undermines global recovery: The Fed is not setting the stage to utilize the US Dollar as a global reflationary tool for the foreseeable future, at least there has been no signs of it given its lack of commitment to project a strong enough dovish message. This is keeping the US Dollar relatively well bid, near multi-year highs against G10 FX exc JPY, CHF, which makes the challenges to recover from a context of a global slowdown, lack of business investment and trade tensions more difficult. The better the US data get, ironically, the worse for the global economy as it keeps the Fed sidelined and with a strong dollar comes increased risks of deflationary pressures, hence an extension of the current themes we are seeing in the bond yields market. Could this change if the US props up speculation of FX intervention?
Trump not in the mood for more 'blinks': Trump continues to sound as if he is not going to offer much in terms of concessions to China, stating that a trade deal has to be 'on our terms'. Meanwhile, from the Chinese side, comments from the local media suggested that Xi and Trump are in touch via meetings/phones, even if the latest reports indicate that China maintains its stance that countermeasures against US tariffs will be taken after they lost whatever trust was left after Trump violated the G20 trade truce. One thing is clear. The market remains very jumpy on any headlines related to trade talks, as the topic has regained the market attention as the central thematic to set the risk tone.
Vol around the Yuan under control for now: The PBOC has kept the Yuan in check by controlling its volatility above the 7.00 mark in USD/CNH terms, with the latest set of action by the Central Bank of China (yuan fixing, liquidity injections) suggesting that they are much more focused on suppressing vol in the market that may cause undesirable mayhem in financial markets. Besides, the overnight borrowing rate in Hong Kong (HIBOR) for offshore yuan hit its highest since October of 2018 at 3.70%, hence making it more expensive to try to short the Yuan.
GE accused of massive fraud: In the US, while the S&P 500 recouped some of its losses, shares of the giant General Electric Company (NYSE:GE) sold by more than 10% in its worst day in many years after Harry Markopolos, Madoff’s whistleblower, released a 175-page report alleging a massive fraud at GE Finance. If authorities find sufficient grounds over these allegations, it could be catastrophic for the junk bond market and risk in general. "My team has spent the past 7 months analyzing GE's accounting and we believe the $38 Billion in fraud we've come across is merely the tip of the iceberg. GE has been running a decade's long accounting fraud by only providing top-line revenue and bottom line profits for its business units and getting away with leaving out the cost of goods sold, SG&A, R&D, and corporate overhead allocations.”
Fed's Bullard retains a dovish rhetoric: Fed’s Bullard (a dovish voter) seems to still be supporting the idea of further insurance rate cuts, noting in an interview with Fox News that “I think we’re in the middle of a global slowdown and we’re just going to have to assess how this is going to affect the U.S. economy”. We might be able to avoid a downturn “if we play our cards right”. Bullard also had the following to say about market movements; “might be a little overdone”, but will be watching closely
Fed's Kashkari on the dovish camp too: Fed's Minneapolis Kashkari (non-voting member) also made comments on the economy and the Fed policy, hinting that he is still leaning towards further rate cuts. Cited by Reuters, the policy-maker said that trade tensions are making businesses cautious, and the inversion of the U.S. yield curve “is an indicator that people are nervous.” On the flip side, Kashkari reiterated the familiar message about the jobs market and consumer spending being strong. He added that “I am leaning towards the camp of, ‘yes we need to give more stimulus to the economy, more support, we need to continue the expansion and not allow a recession to hit us.”
Bank of Mexico joins the global rate-cutting trend: As the global outlook goes from bad to worse, yet another Central Bank, this time the Bank of Mexico, delivered a surprising 25bp rate cut, lowering rates to 8.00% from 8.25%. The decision follows unexpected aggressive easings by the RBNZ, RBI, BT earlier this month, in what’s seen as a universal dovish stance to combat the downside risks in growth.
The Australian jobs market reassures neutral RBA for now: The Australian jobs report came way better-than-estimates after a headline employment change number of +41.1K vs +14.0K expected with the unemployment rate at 5.2% as expected. The break down of full-time employment change was also a solid print of 34.5K, while the part-time accounted for a positive change of 6.7K. The participation rate ticked up to 66.1% vs 66.0% expected. The positive data in the jobs market will be reassuring for the RBA, which may find it warranted to keep rates on hold for a while longer until November or December, although much will depend on the unfolding global slowdown happening before our very own eyes. Also note, the overall underutilization in Australia rose as underemployment went up to 8.4%.
Corbyn sets sights on avoiding no-deal Brexit: The Sterling put on a solid performance on Thursday, after labor opposition leader Corbyn is starting to draw interest of various political circles from opposition parties in order to form an emergency government with the condition of being strictly limited in time so that a hard Brexit can be avoided as fresh elections are arranged. Corbyn seems to be determined to bring a no-confidence motion in PM Boris Johnson’s government at the “earliest opportunity when we can be confident of success”. As a consequence, there has been a marginal price out of a no-deal Brexit by betting houses in the UK, also reflected in the GBP sentiment.
Source: Forexfactory
A Dive Into The Charts
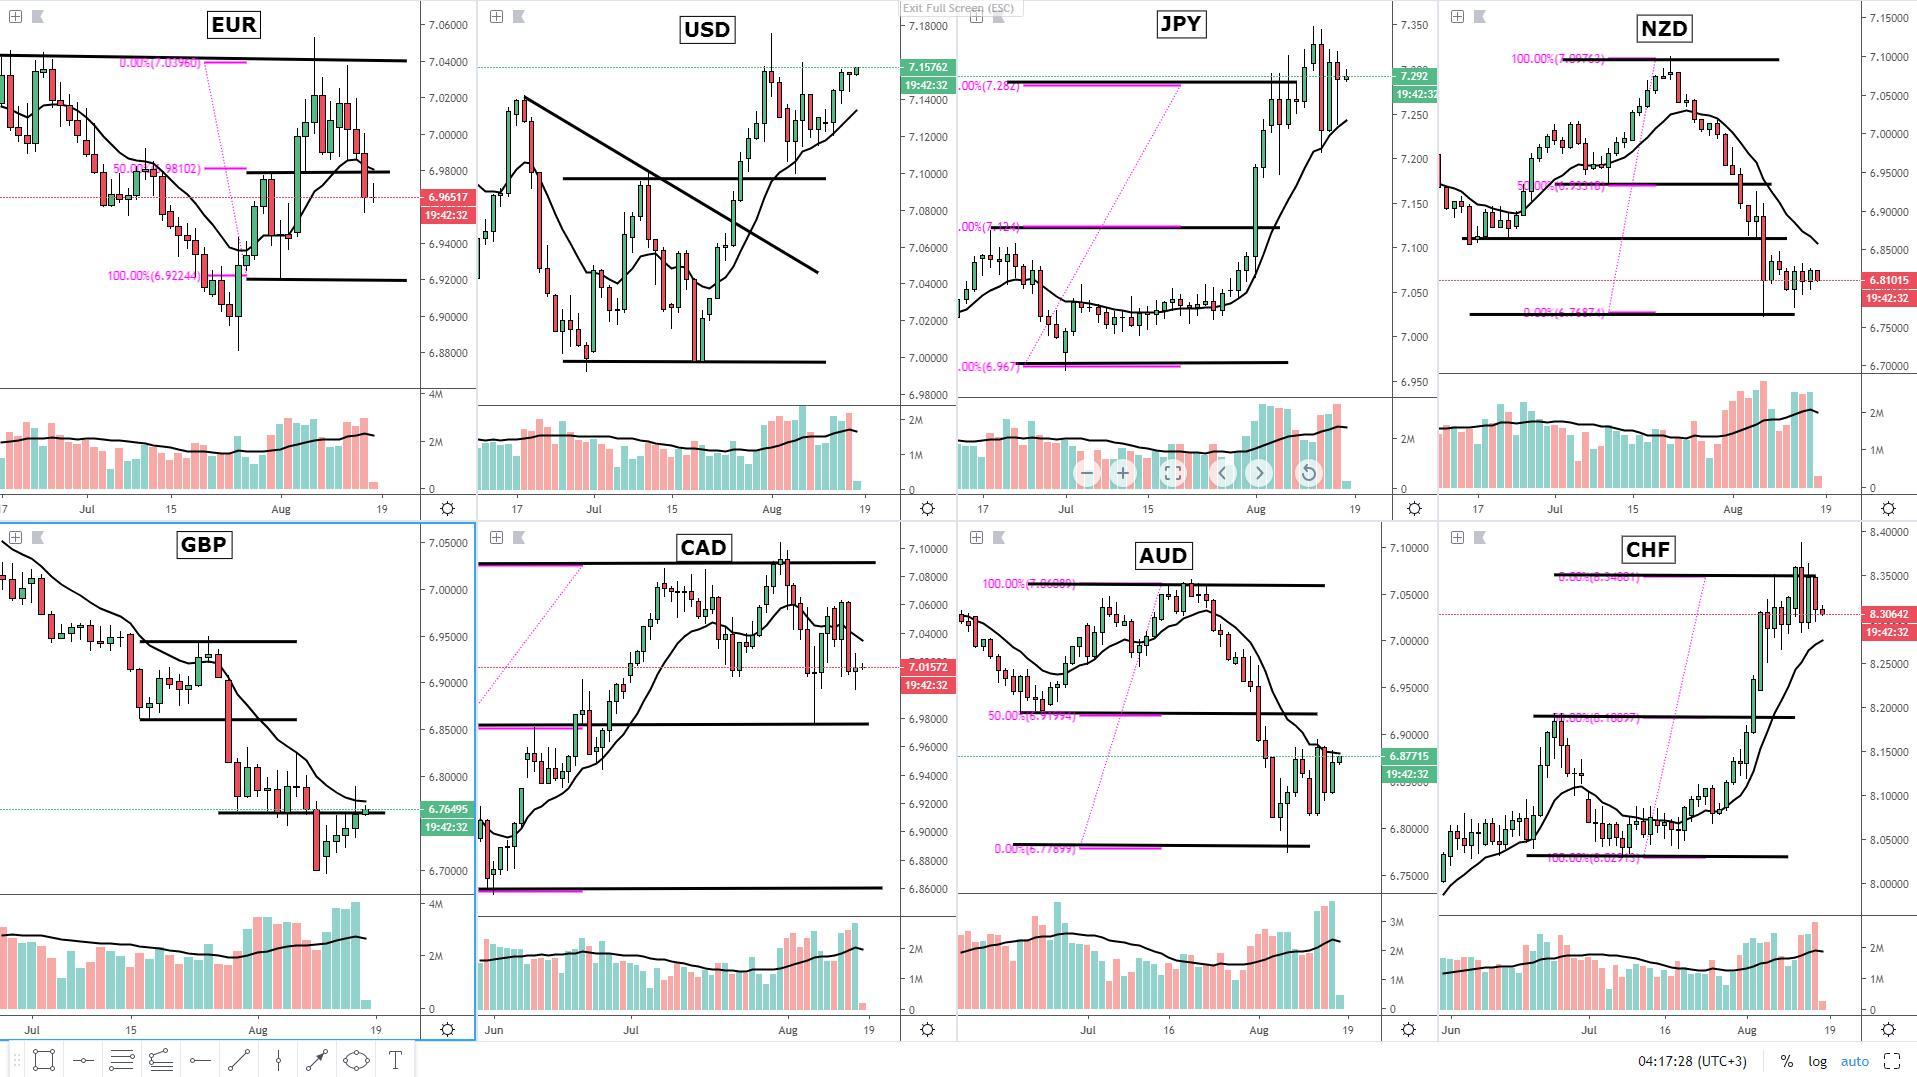
Out of the equally-weighted currency indices, the Euro and the Loonie, both breaking below its baselines with increasing aggregated tick volume, have now officially entered bearish territory as per my system. This makes me especially bearish on the outlook for these 2 currencies this Friday. The question to be asked next is, what currencies look to still be positioned to garner the market’s attention to see further upside? Personally, I like how the market structure in the US Dollar is setting up, as it remains well above the baseline but still not overly extended. Besides, the aggregated tick volume over the last few days has been breaking above the monthly average, which marries really nicely with the latest positive data in the US. Another currency index that remains technically attractive is the JPY, finding plenty of buying interest as reflected by the absorption of volume candle from Thursday rejecting the baseline for a second time this week. Another currency where I see decent chances of an extension higher with recent fundamentals backing up this view (upbeat Aus jobs) is the Aussie, even if one must be aware that technically speaking, we are not quite in a bullish trend yet. Remember, the Aussie index is bouncing off its 100% proj target, which makes the bottom found a meaningful one from which to build longs. The Swissy index appears to have been dragged down and currently weighted by the weakness in the Euro, so I can’t form a strong opinion at this point. Same applies for the NZD or the GBP, even if the latter has ended as one of the top performers in the last 24h, the technicals in the index still look rather poor, with a clear rejection off a confluence resistance area (baseline + old support-turned-resistance).
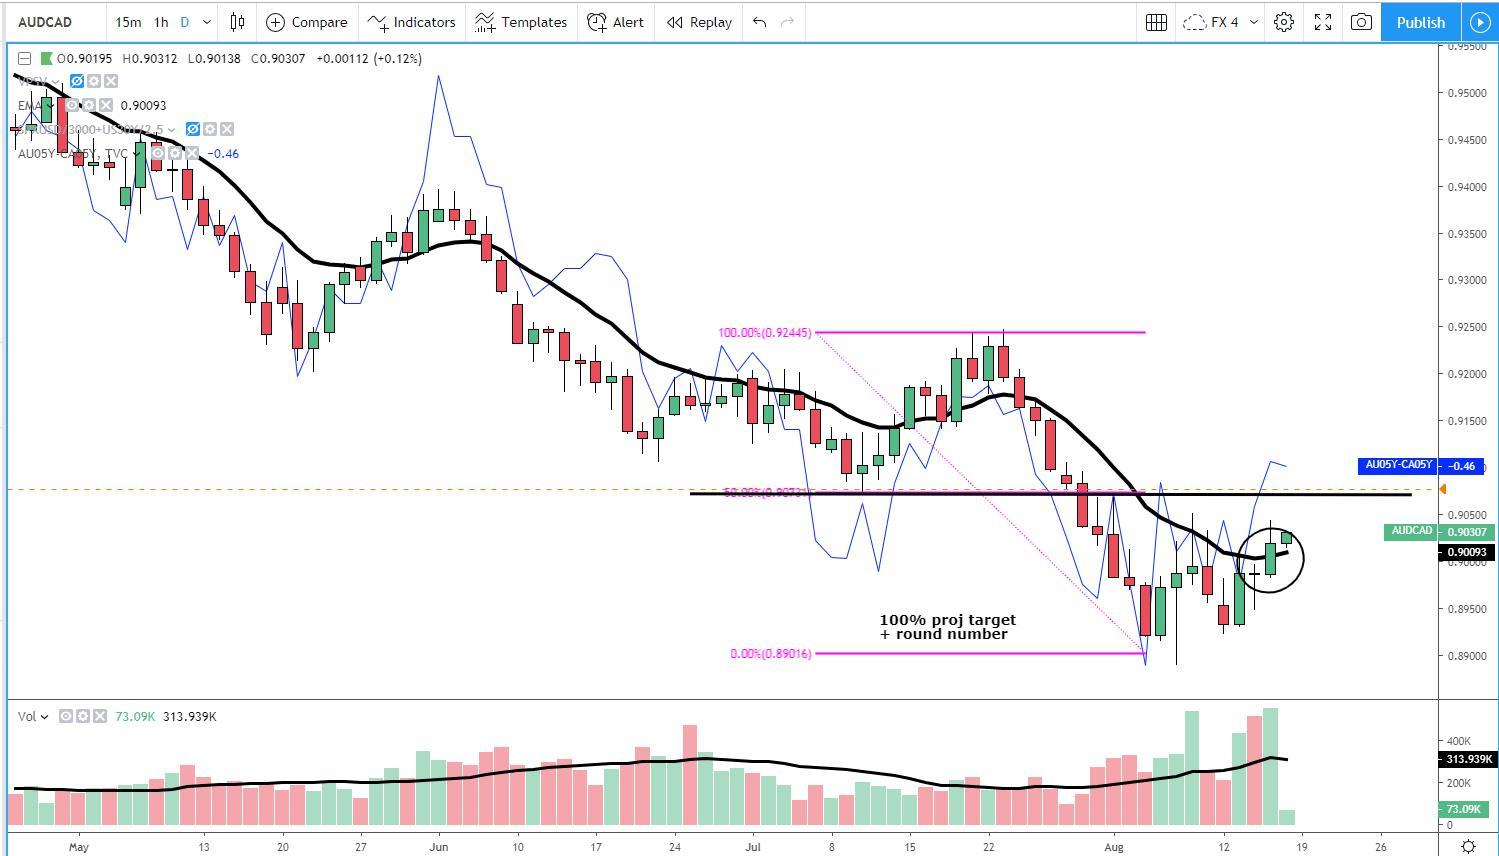
The first potential opportunity on my radar for this Friday includes long-sided business in the Australian Dollar vs the Canadian Dollar. The chart clearly shows bulls regaining the 13-d ema as my preferred baseline to determine which side controls the trend, alongside a major spike in tick volume in the last 24h, adding further substance to a follow-through continuation day. What’s more, the bond yield spread also supports the notion of higher levels. The previous swing low (support) is the next area where I envision the market to be headed before a re-assessment.
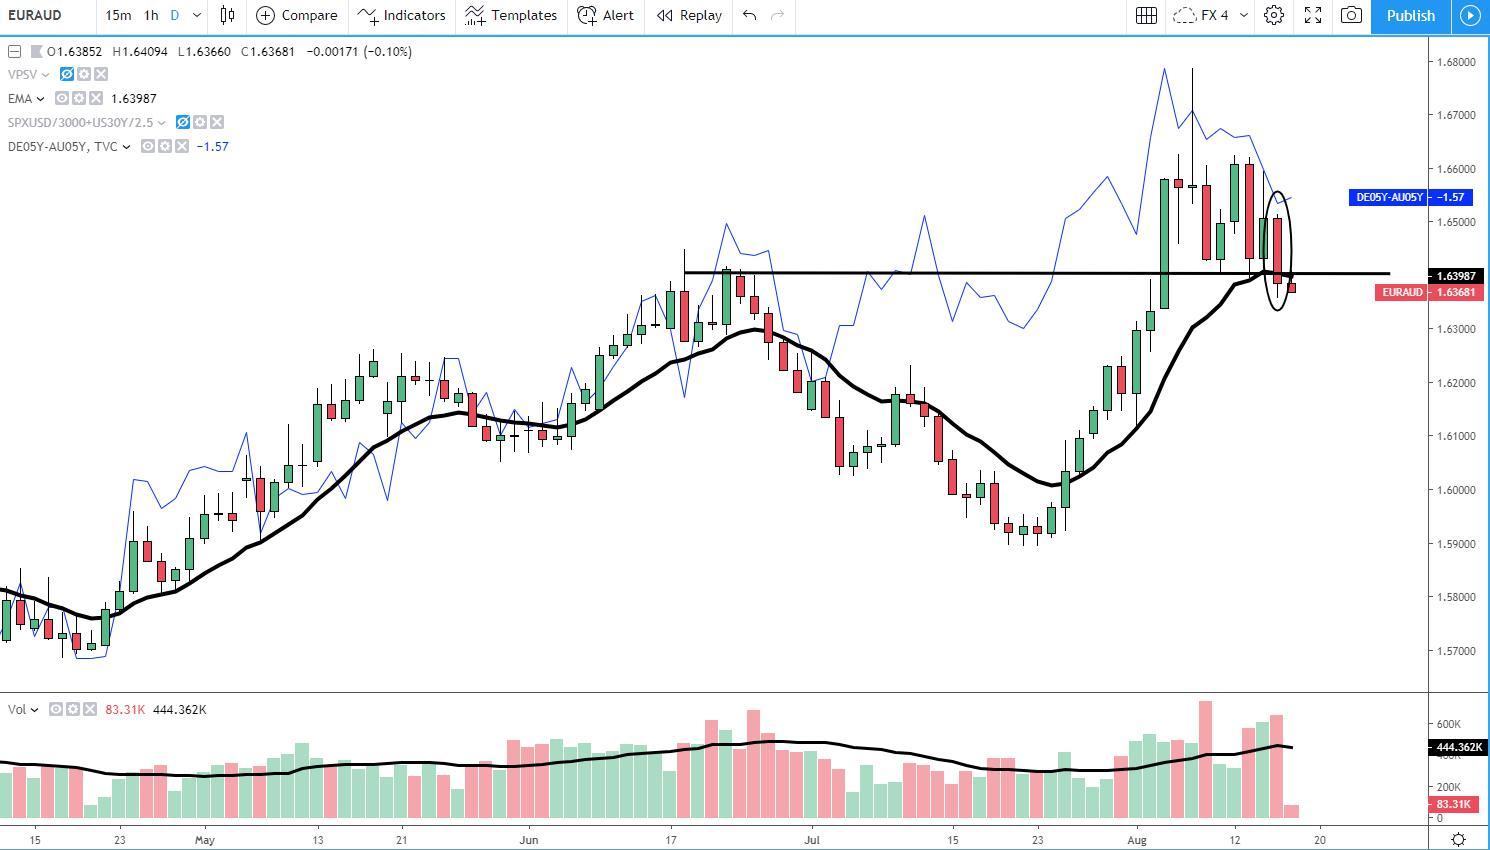
Another trade that involves banking in the potential strength in the Aussie would be to short the EUR/AUD market. Here we can also come to terms that sellers have taken control of the price action, with Thursday’s close below the baseline validating this view. It adds to the bearish case to see that the tick volume has picked up considerably as well, as it does the fact that the fundamental landscape has shifted quite suddenly in favor of shorts after the contrast in news (Aus jobs report a beat on expectations vs ECB’s Rehn hinting aggressive Sept QE measures). The prevailing negative tone in the index has also been reflected in the bond yield spread.
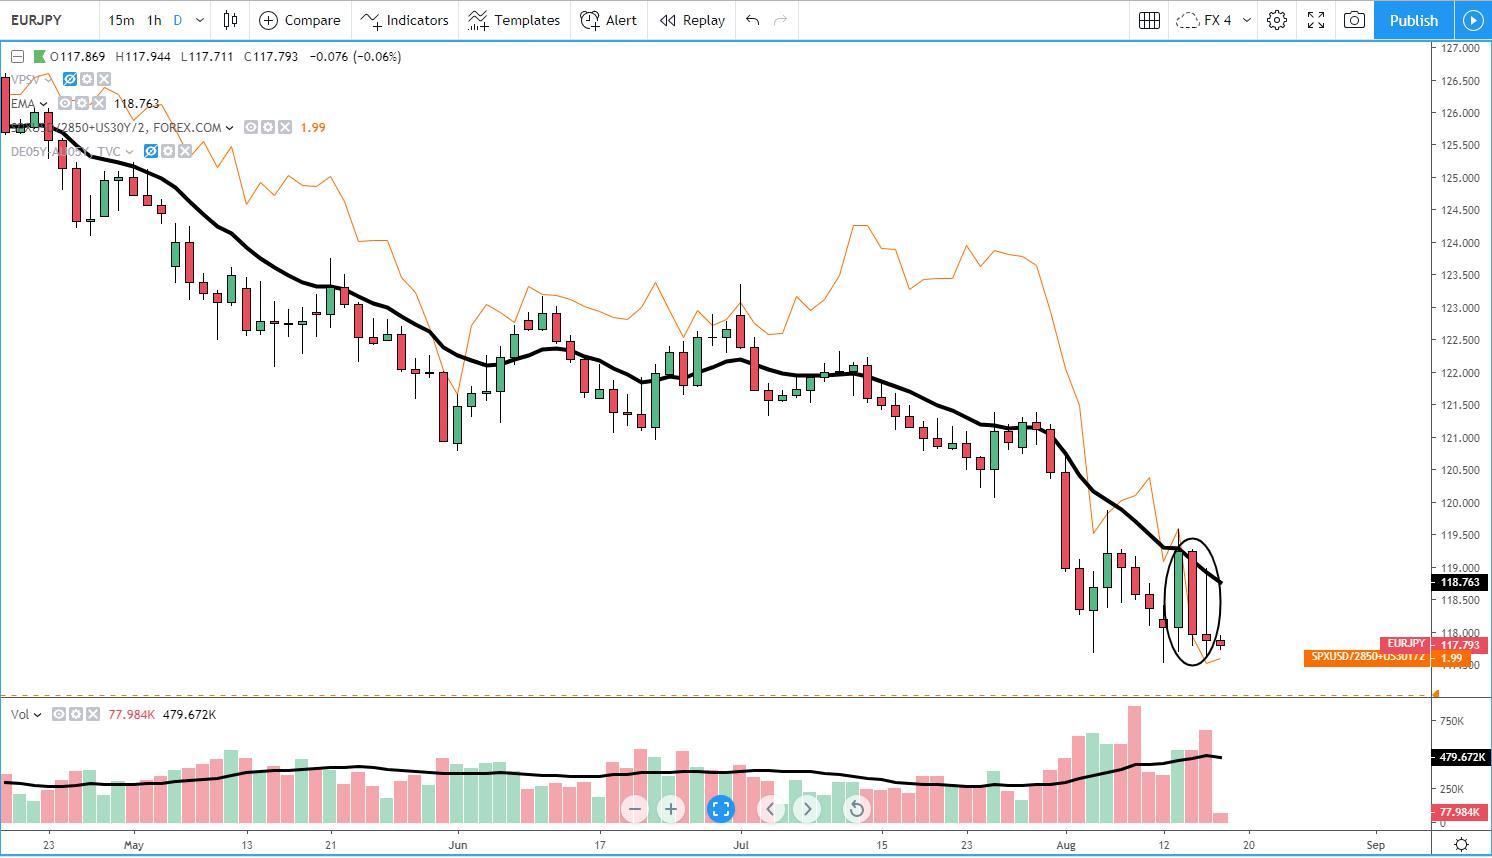
A third market that has my attention and I actually look to capitalize on short-side business includes the EUR/JPY. The chart tells me sellers remains the side in clear control, rejecting upside auctions as the pullbacks off the baseline indicate. I see the bearish rationale well justified via price action, with an inverted pin bar printed, alongside an increase in tick volume, the orange value line (a bundle to measure the performance of equities and bonds) pointing lower, alongside negative fundamentals for the EUR on Rehn’s headlines.
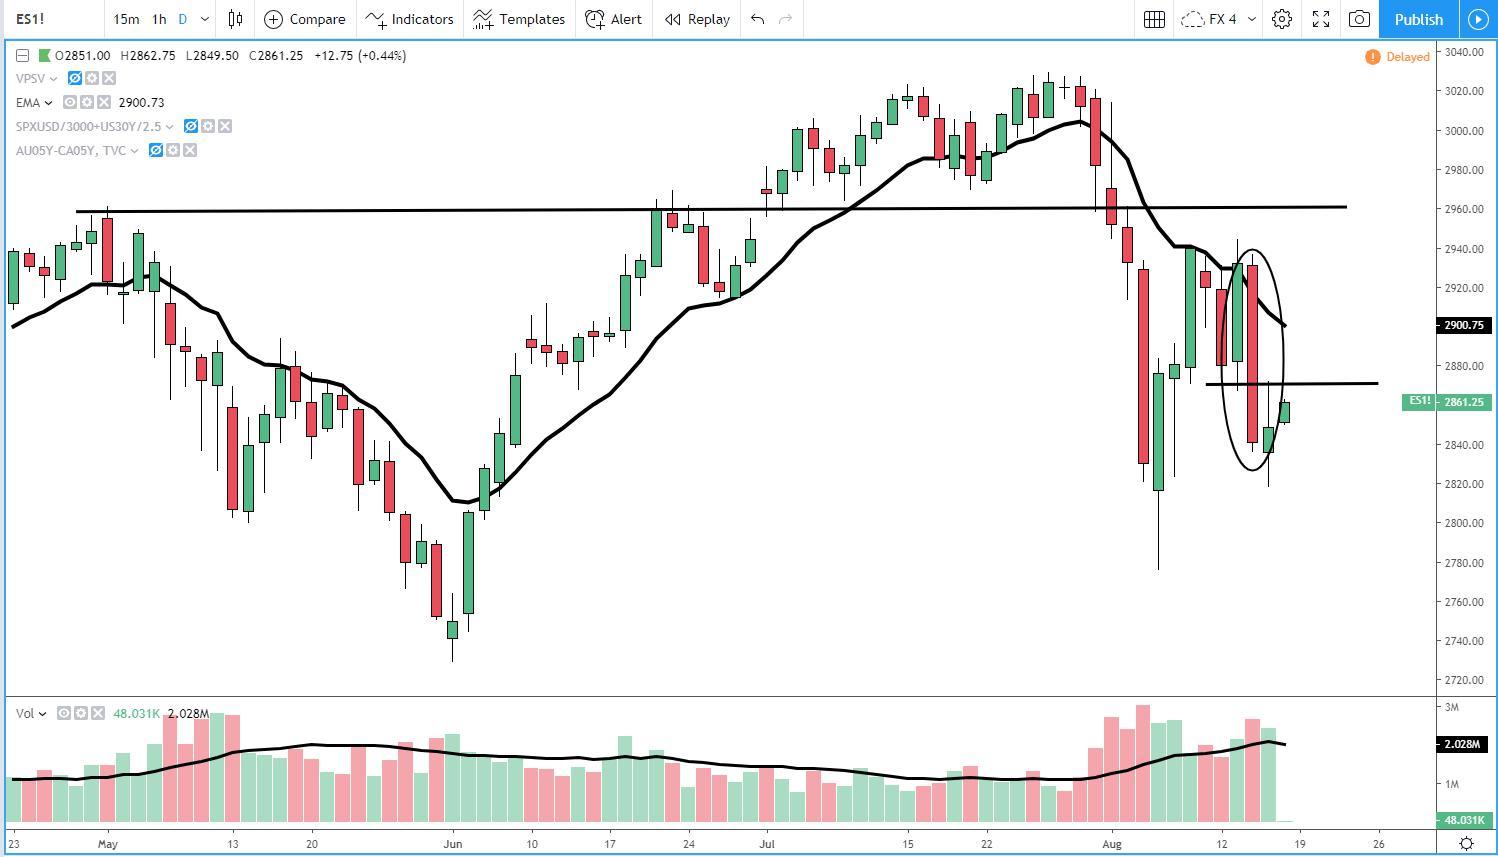
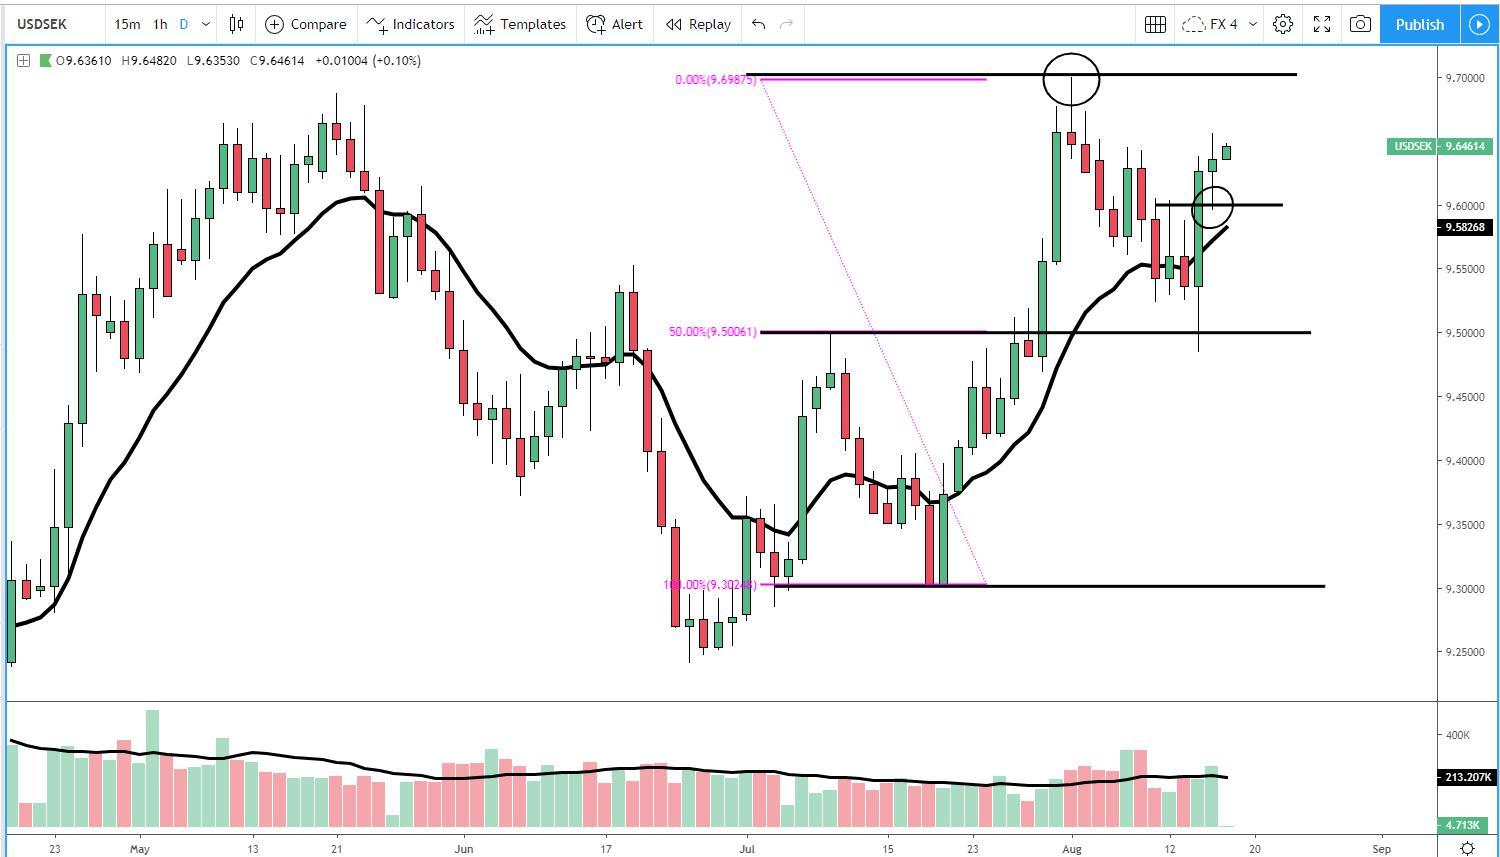
Also, as a reminder, two markets where, as part of Thursday’s note, I suggested we could find a potential opportunity if we saw a pullback that would ease the overdone movements included the S&P 500 (short) and the USD/SEK (long). In both cases, the line drawn in the charts where I’d have expected limit order to restrict the retracement has acted with great accuracy. The next technical move I’d envision after the rejection is for a potential resumption of the downtrend in equities and further strength in the USD against the Sweedish currency.
Important Footnotes
- Risk model: The fact that financial markets have become so intertwined and dynamic makes it essential to stay constantly in tune with market conditions and adapt to new environments. This prop model will assist you to gauge the context that you are trading so that you can significantly reduce the downside risks. To understand the principles applied in the assessment of this model, refer to the tutorial How to Unpack Risk Sentiment Profiles
- Cycles: Markets evolve in cycles followed by a period of distribution and/or accumulation. To understand the principles applied in the assessment of cycles, refer to the tutorial How To Read Market Structures In Forex
- POC: It refers to the point of control. It represents the areas of most interest by trading volume and should act as walls of bids/offers that may result in price reversals. The volume profile analysis tracks trading activity over a specified time period at specified price levels. The study reveals the constant evolution of the market auction process. If you wish to find out more about the importance of the POC, refer to the tutorial How to Read Volume Profile Structures
- Tick Volume: Price updates activity provides great insights into the actual buy or sell-side commitment to be engaged into a specific directional movement. Studies validate that price updates (tick volume) are highly correlated to actual traded volume, with the correlation being very high, when looking at hourly data. If you wish to find out more about the importance tick volume, refer to the tutorial on Why Is Tick Volume Important To Monitor?
- Horizontal Support/Resistance: Unlike levels of dynamic support or resistance or more subjective measurements such as fibonacci retracements, pivot points, trendlines, or other forms of reactive areas, the horizontal lines of support and resistance are universal concepts used by the majority of market participants. It, therefore, makes the areas the most widely followed and relevant to monitor. The Ultimate Guide To Identify Areas Of High Interest In Any Market
- Trendlines: Besides the horizontal lines, trendlines are helpful as a visual representation of the trend. The trendlines are drawn respecting a series of rules that determine the validation of a new cycle being created. Therefore, these trendline drawn in the chart hinge to a certain interpretation of market structures.
- Correlations: Each forex pair has a series of highly correlated assets to assess valuations. This type of study is called inter-market analysis and it involves scoping out anomalies in the ever-evolving global interconnectivity between equities, bonds, currencies, and commodities. If you would like to understand more about this concept, refer to the tutorial How Divergence In Correlated Assets Can Help You Add An Edge.
- Fundamentals: It’s important to highlight that the daily market outlook provided in this report is subject to the impact of the fundamental news. Any unexpected news may cause the price to behave erratically in the short term.
- Projection Targets: The usefulness of the 100% projection resides in the symmetry and harmonic relationships of market cycles. By drawing a 100% projection, you can anticipate the area in the chart where some type of pause and potential reversals in price is likely to occur, due to 1. The side in control of the cycle takes profits 2. Counter-trend positions are added by contrarian players 3. These are price points where limit orders are set by market-makers. You can find out more by reading the tutorial on The Magical 100% Fibonacci Projection
