Friday April 20: Five things the markets are talking about
Global equities are closing out the week on the back foot, stressed mostly by technology stocks coming under earnings-related pressure. U.S Treasury yields are holding above the psychological +2.90% as German Bunds steadied and U.K gilts pared yesterday’s losses.
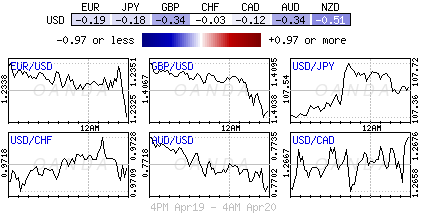
In FX the ‘big’ dollar has managed to extend this week’s advance, while in commodities, crude oil prices have eased a tad, as the rally in metals has stumbled.
Bank of England’s (BoE) Governor Carney comments on Thursday managed to send the sterling to a two-week low of £1.4045 – he said that “due to softer economic data, the BoE may consider not raising interest rates in May, as most were expecting.”
Note: Both UK inflation and retail sales data this week were both lower than in the previous periods and below market expectations. The odds for a May hike have dropped to +50%, earlier this week futures traders were looking at +80% possibility.
On Tap: Canadian retail sales and inflation data due at 08:30 am EDT.
1. Stocks slip on tech pressure
In Japan, the Nikkei share average edged lower overnight as worries about slower smartphone demand hit technology shares, while financial stocks found support on the back of higher U.S yields. The Nikkei gave up -0.1% – the index has rallied +1.8% for the week, its fourth consecutive week of gains. The broader Topix rallied +0.1%.
Down-under, Aussie shares snap five sessions of gains, as the recent commodity prices rally paused for breath. The S&P/ASX 200 index fell -0.1%, but managed to close out the week higher for the consecutive time. In S. Korea, the Kospi fell -0.3%.
In Hong Kong, stocks end lower on a slump in energy shares prices from their two-month high print Thursday. The Hang Seng index ended down -0.9%, while the China Enterprises Index closed -1.5% lower.
In China, stocks post their worst week in a month on trade war concerns. The blue-chip CSI 300 index closed down -1.3%, while the Shanghai Composite Index dropped -1.5%.
In Europe, regional indices are trading mixed, – materials and energy stocks are under pressure following retracement in commodities and oil. In the U.K, Brexit negotiation concerns are weighing on sentiment.
In the U.S, stocks are expected to open in the ‘black (-0.2%).
Indices: Stoxx 50 +0.1% at 3,487, FTSE +0.3% at 7,367, DAX -0.2% at 12,545, CAC 40 -0.1% at 5,388; IBEX 35 +0.1% at 9,877, FTSE MIB -0.1% at 23,760, SMI -0.4% at 8,798, S&P 500 Futures -0.2%

2. Oil dips, but trades atop of its four year highs, gold higher
Ahead of the US open, crude oil prices trade near their three-year highs, supported by ongoing OPEC led supply cuts and strong global demand drawing down excess supplies.
Brent crude oil futures are at +$73.74 per barrel, down -4 cents from Thursday’s close, while US West Texas Intermediate (WTI) crude futures are down -13c at +$68.16 a barrel.
Note: Both Brent and WTI hit their highest levels since November 2014 on Thursday, at $74.75 and $69.56 per barrel respectively. WTI is set for its second weekly gain, climbing more than +1% this week, while Brent is also poised to rise for a second week, adding around +1.5%.
Beyond OPEC and company’s supply management, crude prices have also been supported by market expectations that the US will re-introduce sanctions on OPEC-member Iran.
Gold prices have inched a tad lower ahead of the U.S open and are headed for the first weekly decline in three-weeks on expectations of higher U.S rates and easing political tensions on the Korean Peninsula and Syria weighing on demand for the safe-haven metal. Spot gold is down -0.1% at +$1,344.10 an ounce, while U.S gold futures have fallen -0.2% to +$1,346.30 per ounce. Spot gold is on the cusp of falling -0.2% on the week.

3. Sovereign yields back up
With the inflationary implications of commodity prices gaining strongly this week, and geopolitical risks fading, has supported global sovereign bond yields to back up.
Stateside, the US 10 year Treasury yield has suddenly spiked above +2.90% and to levels not seen since the FOMC rate hike in March.
The speed of this week’s rise has allowed the U.S yield curve to steepen slightly. The 2’s/10’s spread has pushed out from +43 bps earlier this week up to +47bps, and this in turn has helped the dollar find a bid.
Elsewhere, in Germany, the 10-year Bund yields are unchanged at +0.60%. In the UK, the 10-year Gilt yield has dipped -4 bps to +1.5%, while in Japan, the 10-year JGB yield has climbed +2 bps to +0.06%, the highest in seven-weeks.

4. EUR/CHF deja vu
EUR/CHF has rallied back above the infamous €1.2000 handle, again this morning, reaching €1.2008, its highest since the Swiss National Bank (SNB) ended its policy of keeping a €1.20 EUR/CHF floor in early 2015.
However, for now, it has failed to stay, last trading down -0.1% at €1.1974. Expect the market to remain cautious following the pair’s rapid appreciation.
Note: EUR/CHF has rallied from €1.15 early March to today’s €1.20+ handle.
GBP/USD (£1.4066) has continued its soft tone in the aftermath of Governor Carney’s comments yesterday that seems to doubt on a BoE rate hike next month. He emphasized yesterday that markets should “not get overly focused on the exact timing of hikes but attuned to the general path of rates.”
With the mild inflation data throughout Europe in recent weeks could get ECB’s Draghi to verbally push back on EUR strength. ECB rhetoric of late has been all about ‘patience’ and dealers and investors seem to believe that any change in guidance would come in June rather at next week’s ECB meeting (April 26).
Higher US yields is supporting USD/JPY as its move above the psychological ¥107.50 to ¥107.66. The Bank of Japan (BoJ) also meets next week.

5. German producer prices rise
German data this morning showed that in March the index of producer prices for industrial products rose by +1.9% y/y.
In February the annual rate of change all over had been +1.8%.
Digging deeper, the March price indices of all main industrial groups increased compared with the previous year – energy prices were up +2.4%, while prices of electricity increased by +5.5%, whereas prices of petroleum products were up +1.3% and prices of natural gas (distribution) rose by +0.2%.
The overall index, disregarding energy, was +1.7% up on March 2017 and +0.1% compared with February.