
EUR/USD: Stay short for 1.1070 after not-so-dovish Fed
Macroeconomic overview: The Federal Reserve has raised its target rate by another 25 bp, and left its medium-term interest rate projections unchanged. That includes one more rate hike in the second half of this year, followed by three hikes in each 2018 and 2019.
In addition, the Fed published details about how it intends to gradually shrink its balance sheet. The Committee anticipates this tapering to begin “this year”.
Just from the statement and the updated Summary of Economic Projections, one would not be able to guess that core inflation numbers have been disappointing for three months in a row. The only hints were a small tweak in the statement (“on a 12-month basis, inflation has declined recently”) and a downward revision of the 2017 inflation forecast.
However, all other forecast - from the 2018 and 2019 inflation projections to the median interest rate projections (“dots”) - have remained unchanged. And the statement reiterated the FOMC’s confident outlook that further gradual hikes are warranted as inflation will stabilize around the 2% objective “over the medium term.”
Moreover, the Committee continued to push ahead with its plan to start reducing the size of its balance sheet. The statement echoed the message from the previous FOMC minutes that this normalization is likely to start this year: ”The Committee currently expects to begin implementing a balance sheet normalization program this year.” An “Addendum to the Policy Normalization Principles and Plans” provided further details.
Most importantly:
– The Committee intends to gradually reduce the Federal Reserve's securities holdings by decreasing its reinvestment of the principal payments it receives from securities held in the SOMA. Specifically, such payments will be reinvested only to the extent that they exceed gradually rising caps.
– Caps for Treasuries will be USD 6 bn per month initially, and increase in steps of USD 6bn at three-month intervals over 12 months until it reaches USD 30 bn per month.
– Caps for agency debt and MBS will be USD 4bn per month initially and increase in steps of USD 4bn at three-month intervals over 12 months until it reaches USD 20 bn.
The Commerce Department said retail sales fell 0.3% last month after an unrevised 0.4% increase in April. May's decline was the largest since January 2016 and confounded market expectation for a 0.1% gain. Retail sales rose 3.8% in May on a year-on-year basis. Some of the drop in monthly retail sales reflected lower gasoline prices, which weighed on receipts at service stations.
Excluding automobiles, gasoline, building materials and food services, retail sales were unchanged last month after an upwardly revised 0.6% rise in April. These so-called core retail sales correspond most closely with the consumer spending component of gross domestic product and were previously reported to have increased 0.2% in April. Growth is expected to pick up this quarter after being held back by a near stall in consumer spending and a slower pace of inventory investment at the start of the year. The economy grew at a 1.2% annualized rate in the first quarter after notching a 2.1% pace in the October-December period.
The Atlanta Fed is forecasting the economy growing at a 3.0% annualized rate in the second quarter, but this estimate could be trimmed following the weak core retail sales.
The Labor Department said on Wednesday its consumer price index dipped 0.1% last month after rising 0.2% in April. In the 12 months through May, the CPI increased 1.9%. That was the smallest increase since last November and followed a 2.2% gain in April. The year-on-year gain in the CPI was still larger than the 1.6% average annual increase over the past 10 years. The market had forecast the CPI unchanged last month and advancing 2.0% from a year ago.
The so-called core CPI, which strips out food and energy costs, edged up 0.1% last month after a similar gain in April. The monthly core CPI was restrained by decreases in the prices of apparel, airline fares, communication and medical care services. The core CPI increased 1.7% year-on-year, the smallest rise since May 2015, after advancing 1.9% in April. May's increase was just below the 1.8% average annual increase over the past decade.
The EUR/USD jumped after lower-than-expected U.S. CPI and retail sales data to 1.1295 yesterday. The move was short-lived and the USD recovered briefly after less dovish than expected Fed statement.
Technical analysis: Another day and another close below 14-day exponential moving average, but we have still no close below 23.6% fibo of May-June rally at 1.1179. Long upper wick on yesterday’s candlestick suggests the near-term outlook is bearish. 
Short-term signal: Our previous short was closed at the entry level, but after the FOMC statement we have opened another short at 1.1235 with the target at 1.1070.
Long-term outlook: Bullish
USD/CHF: SNB keeps its policy unchanged
Macroeconomic overview: The SNB kept its target range for three-month Swiss franc LIBOR at -1.25% to -0.25%, and the rate it charges on sight deposits at -0.75%, as widely expected.
It said it remained committed to negative interest rates and currency market interventions to rein in the Swiss franc, which it said remained "significantly overvalued".
The SNB said the global economy was strengthening as expected and labour markets were picking up while inflation remained modest in most advanced economies.
The SNB said: "In its new baseline scenario for the global economy, the SNB anticipates that economic developments will remain favourable. The cautiously optimistic baseline scenario continues to be subject to considerable downside risks; this is due to political uncertainty and structural problems in a number of advanced economies."
The SNB also said it still expected Swiss economic growth of roughly 1.5%, as forecast in March. Swiss inflation remained weak. The SNB kept its 2017 inflation forecast of 0.3 % but trimmed its 2018 outlook to 0.3% from 0.4 and its 2019 forecast to 1% from 1.1%.
The central bank has also been closely observing political developments around the world, and responding to uncertainty in the Eurozone by intervening in the currency markets to meet demand for the safe-haven franc.
Data has indicated the bank has bought more than CHF 47 billion of foreign currency this year as it stepped up its currency interventions, although the amounts have been scaled back in recent weeks.
SNB Chairman Thomas Jordan said interest rates may go further into negative territory if needed.
Technical analysis: Long lower wick on yesterday’s candlestick suggests the near-term outlook is bullish. The USD/CHF is trying to break above 23.6% of May-June rally today. A close above this level would be another bullish signal. 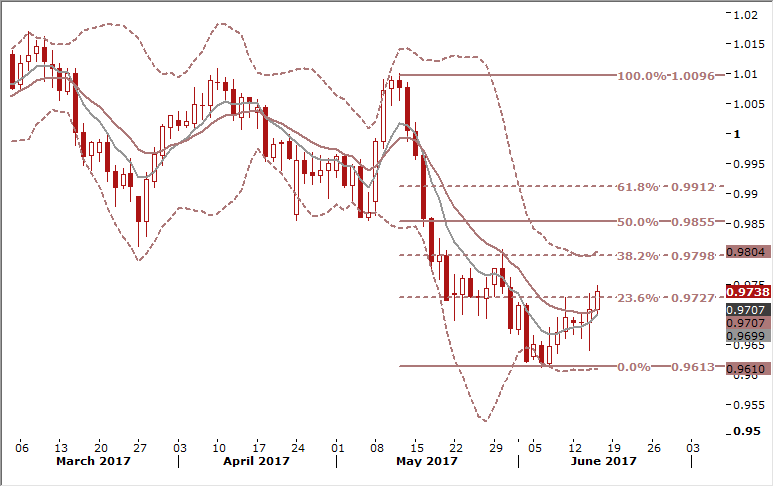
Short-term signal: Our bid order at 0.9670 was filled yesterday. We are long for 0.9850.
Long-term outlook: Flat
AUD/USD: Aussie supported by strong jobs report
Macroeconomic overview: The Australian dollar leapt on Thursday following an upbeat job report. Australia's seasonally adjusted unemployment rate unexpectedly fell to 5.5% in May of 2017 from 5.7% in April and below market estimates of 5.7%. It was the lowest jobless rate since February 2013, as the economy added 42k jobs. The market had expected an increase by 10k.
Full-time employment increased by 52.1k, while part-time employment decreased by 10.1k. This marked the eighth straight month that full-time employment has risen with 124k full-time jobs added over the past 6 months.
The much stronger than anticipated rise in employment in May and the larger than expected fall in the unemployment rate will go some way to quashing growing talk of the chance of another interest rate cut by the Reserve Bank later this year. Interbank futures widened the odds of a rate cut with the December contract giving an 8% chance of a move, from 14% before the data. Markets are even pricing in a small probability of a tightening by May next year.
Technical analysis: The AUD/USD remains above the 7-day exponential moving average, which highlights the short-term bullish structure. The pair broke above 61.8% fibo of March-May drop at 0.7588 yesterday, but did not manage to close above this level. Today we can see another attempt to close above this resistance. We expect that upward move will be continued and buying on dips seems to be a good trading idea.
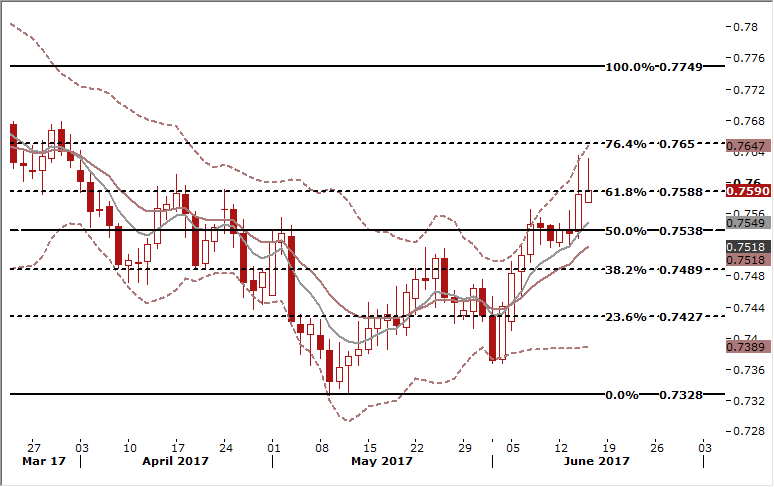
Short-term signal: We are looking to get long on dips. Buy at 0.7480.
Long-term outlook: Bullish
NZD/USD: Kiwi undermined by weaker-than-expected GDP data
Macroeconomic overview: New Zealand's economy grew 0.5% in the three months to March, picking up only slightly from 0.4% in the fourth quarter of 2016. The number was lower than the 0.7% growth expected by the market and well below the central bank's forecast for 0.9% growth.
Agriculture was the main driver of GDP growth and expanded 2.8% following a 0.8% contraction in the previous quarter. Mining fell at a softer pace in the first quarter, contracting 1.0% after plunging 2.1% in the last three months of 2016. Meanwhile, manufacturing rebounded 1.0% following a 1.6% decline. Utilities also notched a better performance, expanding 2.1% following static growth.
Contrastingly, construction dipped 2.1% after expanding 1.4% in the fourth quarter of last year. All building sectors declined, with non-residential building construction being the key driver. Meanwhile, services expanded at a softer pace of 0.4% after growing 0.8% in the preceding three months, with transport falling 2.0% after a 0.9% decline.
Weaker-than-expected GDP data undermined the NZD. For the Reserve Bank of New Zealand, the outcome reinforces the case to keep rates on hold.
Technical analysis: Despite today’s corrective move, the NZD/USD remains above the 14-day exponential moving average, which keeps the bullish structure intact. We think the NZD/USD is on the way to full retracement of the February-May fall. 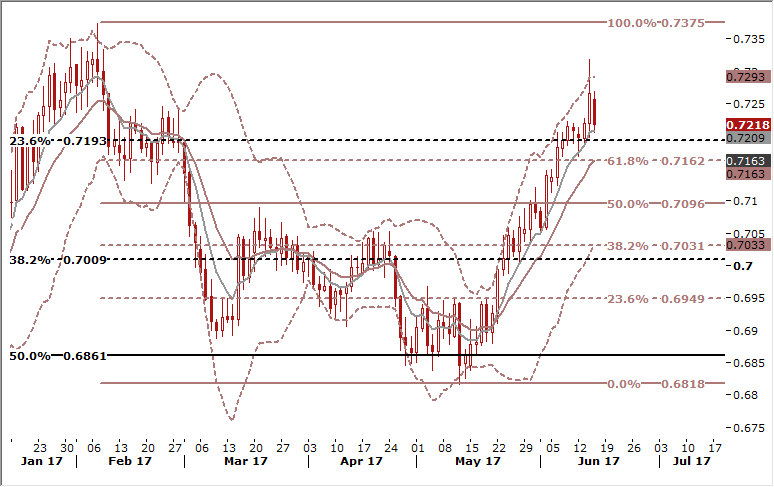
Short-term signal: We are looking to use the corrective move to open a long position. Our bid is at 0.7140.
Long-term outlook: Bullish
GBP/USD: BoE to remain on hold today
Macroeconomic overview: British retail sales volumes fell 1.2% mom May, a heavier downturn that the median forecast for a fall of 0.8% mom. British households have been pinched by a rise in inflation, caused in large part by the fall in the value of the pound since last year's referendum decision to leave the European Union, and by a slowdown in pay growth. Data this week showed inflation hitting its highest level in nearly four years at 2.9% while pay, when adjusted for inflation, fell by the most since 2014.
Today the Bank of England’s MPC publishes its monetary policy decision and the MPC minutes of its meeting. We expect the vote to maintain the bank rate at 0.25% to be 7-1, with Kristin Forbes again voting for an immediate 25bp hike (Forbes leaves the MPC this month).
The GBP is unlikely to receive any support from today’s BoE monetary policy announcement. The MPC will almost certainly sit on its hands, and the tone is likely to be “dovish” compared to the May meeting. More and more concrete signs of an ongoing economic slowdown in the UK – most recently in yesterday’s labor market report, which showed wage growth weakening further – mean there is a greater willingness at the BoE to tolerate higher inflation. Furthermore, there continues to be great political uncertainty, with Theresa May holding coalition talks to form a minority government, and Brexit negotiations scheduled to begin next week. Overall, the focus remains firmly on politics, where elevated uncertainty is likely to cause further sterling weakness.
An evening speech by Chancellor Philip Hammond is expected to lay out his vision of a business-friendly Brexit and will be eyed for signs of a softening of budget cuts after May's Conservatives lost their majority in an election a week ago.
Technical analysis: The GBP/USD weakness extends back into the 1.2600s after Wednesday’s price action formed a Doji on the candles. The pair closed yesterday back into the cloud despite the earlier break to the upside. Technical analysis points to bearish GBP/USD outlook. 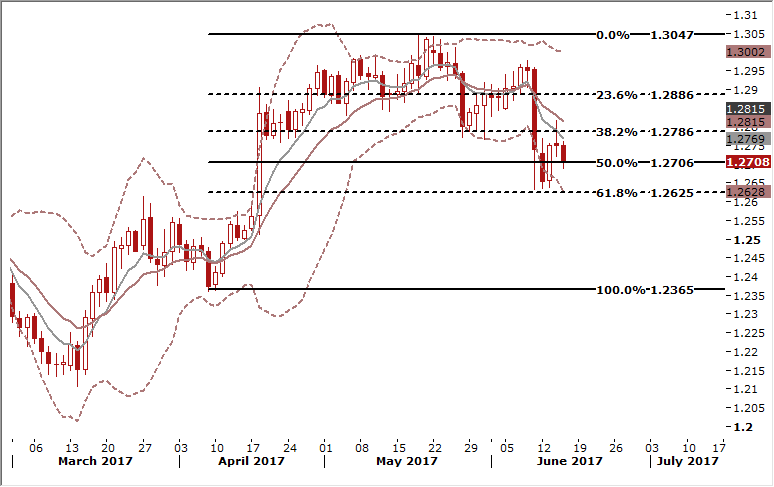
Short-term signal: We stay sideways due to elevated political uncertainty
Long-term outlook: Flat
TRADING STRATEGIES SUMMARY:
FOREX - MAJOR PAIRS: 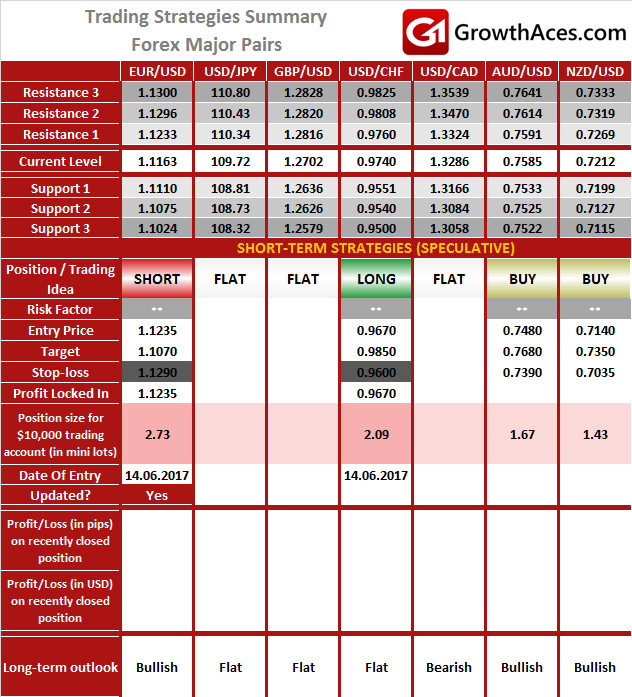
FOREX - MAJOR CROSSES: 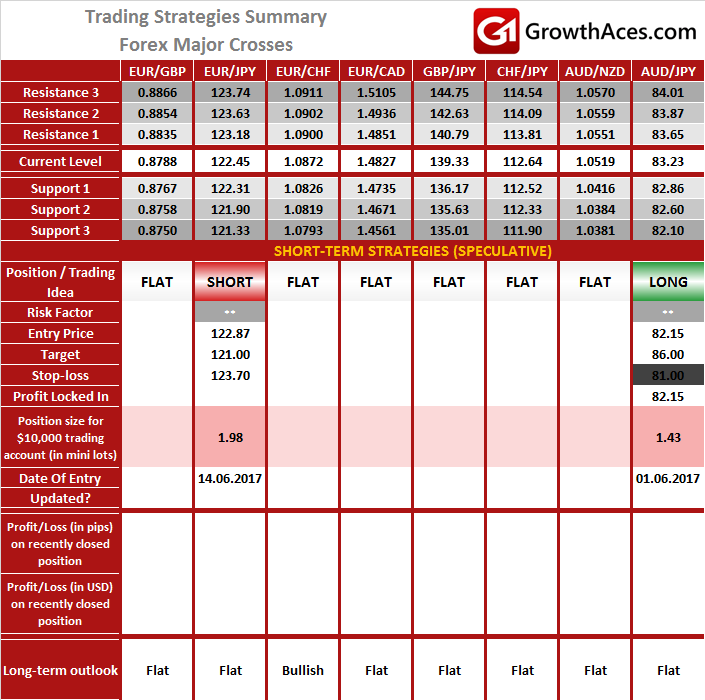
PRECIOUS METALS: 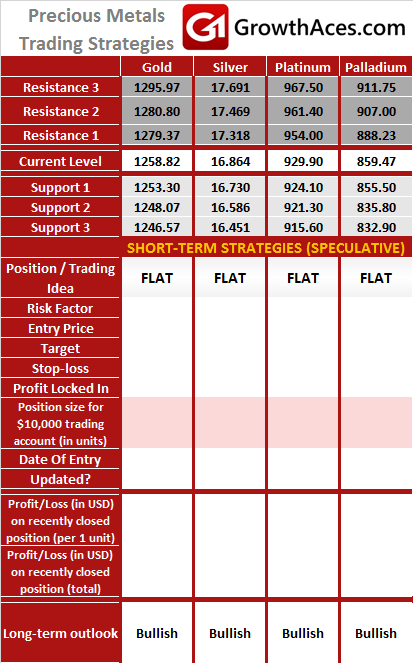
How to read these tables?
1. Support/Resistance - three closest important support/resistance levels
2. Position/Trading Idea:
BUY/SELL - It means we are looking to open LONG/SHORT position at the Entry Price. If the order is filled we will set the suggested Target and Stop-loss level.
LONG/SHORT - It means we have already taken this position at the Entry Price and expect the rate to go up/down to the Target level.
3. Stop-Loss/Profit Locked In - Sometimes we move the stop-loss level above (in case of LONG) or below (in case of SHORT) the Entry price. This means that we have locked in profit on this position.
4. Risk Factor - green "*" means high level of confidence (low level of uncertainty), grey "**" means medium level of confidence, red "***" means low level of confidence (high level of uncertainty)
5. Position Size (forex)- position size suggested for a USD 10,000 trading account in mini lots. You can calculate your position size as follows: (your account size in USD / USD 10,000) * (our position size). You should always round the result down. For example, if the result was 2.671, your position size should be 2 mini lots. This would be a great tool for your risk management!
Position size (precious metals) - position size suggested for a USD 10,000 trading account in units. You can calculate your position size as follows: (your account size in USD / USD 10,000) * (our position size).
6. Profit/Loss on recently closed position (forex) - is the amount of pips we have earned/lost on recently closed position. The amount in USD is calculated on the assumption of suggested position size for USD 10,000 trading account.
Profit/Loss on recently closed position (precious metals) - is profit/loss we have earned/lost per unit on recently closed position. The amount in USD is calculated on the assumption of suggested position size for USD 10,000 trading account.
Source: GrowthAces.com - your daily forex trading strategies newsletter