
EUR/USD
 EUR/USD" title="EUR/USD" width="600" height="600">
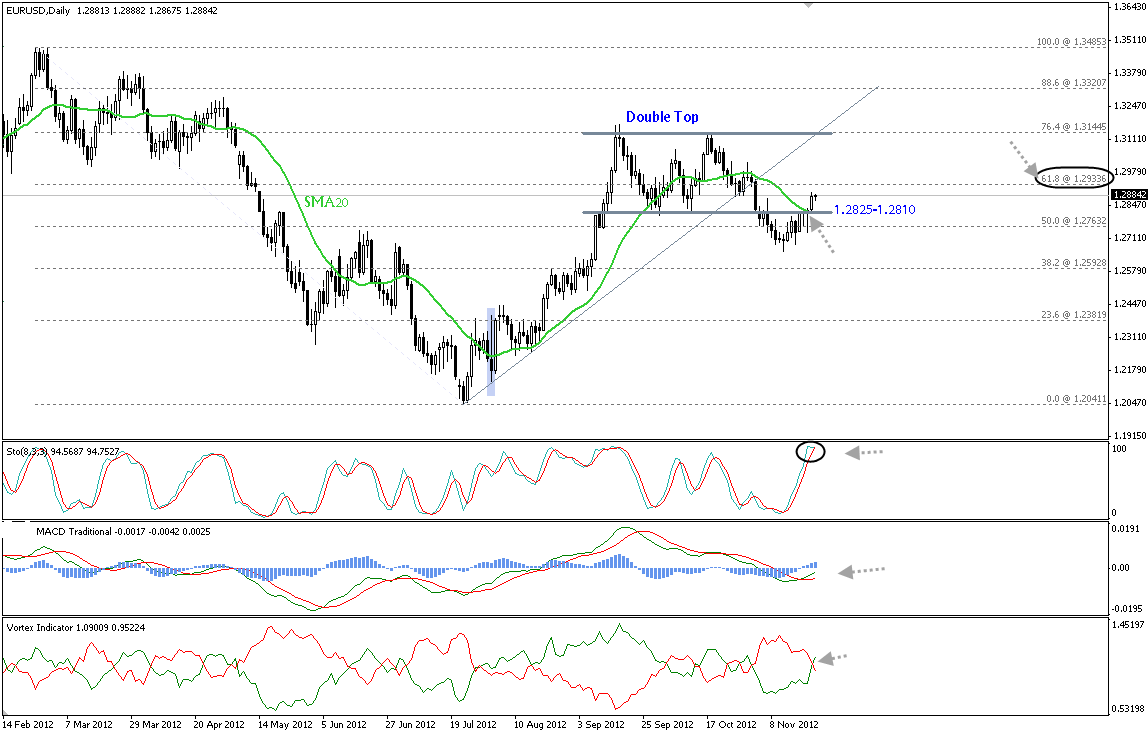
With the pair's closing above the neckline zones of the double top formation, the bearish effect of this pattern becomes very weak. We can see also how SMA 20 was taken out and that activated positive signs on MACD and Vortex indicators. But, we will stand aside today as the pair is very close to a very hard technical obstacle where 61.8% Fibonacci retracement level of the downside wave from 1.3485 to 1.3040 exists; thus the risk versus reward ratio is inconvenient for the time being.
The trading range for today is among key support at 1.2700 and key resistance at 1.3000.
The general trend over the short-term is to the downside targeting 1.1865 as far as areas of 1.3550 remain intact. 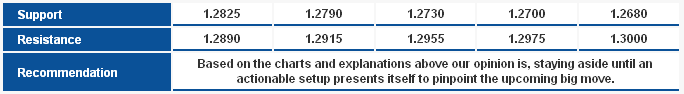 EUR/USD_S&R" title="EUR/USD_S&R" width="684" height="94">
GBP/USD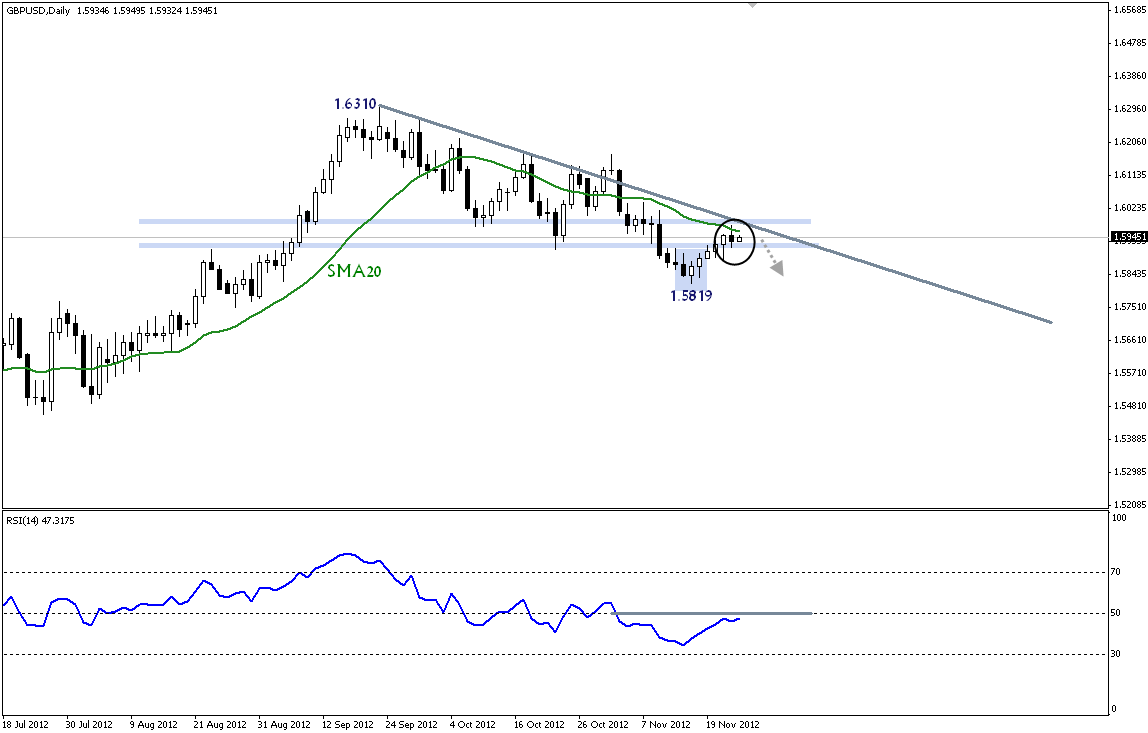 GBP/USD" title="GBP/USD" width="600" height="600">
The recovery from 1.5820 stalled at SMA 20 which pushed the pair lower once again as seen on the provided daily chart. RSI 14 is facing a resistance at the value of 50.00 while the falling trend line continues to pressure the correctional movements. Henceforth, we remain bearish over upcoming hours awaiting for a sustained breakout below 1.5925 pivotal support to confirm our scenario.
The trading range for today is among key support at 1.5740 and key resistance at 1.6125.
The general trend over the short-term is to the downside targeting 1.4225 as far as areas of 1.6875 remain intact. 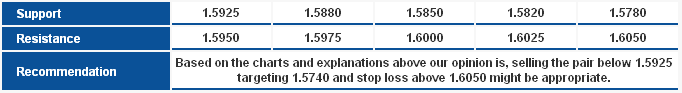 GBP/USD_S&R" title="GBP/USD_S&R" width="682" height="93">
USD/JPY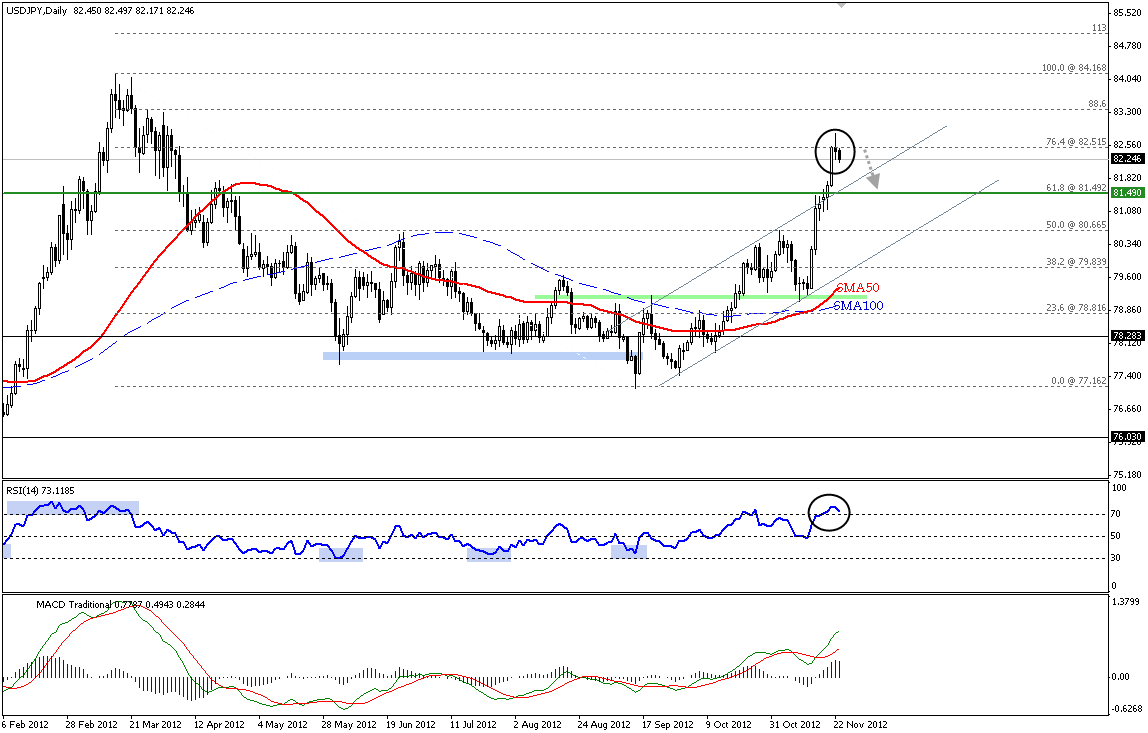 USD/JPY" title="USD/JPY" width="600" height="600">
In conformity with yesterday’s proposed negative scenario, traders have pushed the pair to the downside from 76.4% Fibonacci level. However, RSI 14 on a daily graph reflects obvious overbought signal as it is still valued at the value of 73.00 despite yesterday’s decline. From here, more downside pressures are awaited over intraday basis mainly targeting 61.8% Fibonacci level at 81.50. Of note, the major trend over bigger time frames is still bullish while the current bearish movements are classified as a normal correction.
The trading range for today is among key support at 81.25 and key resistance now at 83.65.
The general trend over the short-term is to the upside targeting 87.45 as far as areas 75.20 remain intact. 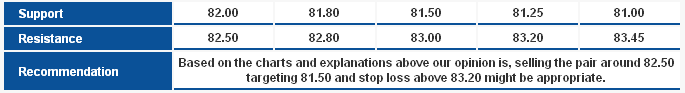 USD/JPY_S&R" title="USD/JPY_S&R" width="685" height="93">
USD/CHF USD/CHF" title="USD/CHF" width="600" height="600">
Thin trading governs the market with the Thanksgiving holidays in the United States. The pair breached the main harmonic support and stabile below the second target of the bearish Butterfly Pattern at 0.9365 and accordingly we favor the extension of the downside move. The bearish move depends on intraday stability below 0.9425.
The trading range for today is among the key support at 0.9245 and key resistance at 0.9490.
The general trend over short-term is to the downside targeting 0.8860 as far as areas of 0.9775 remains intact. 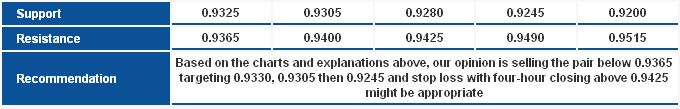 USD/CHF_S&R" title="USD/CHF_S&R" width="680" height="109">
USD/CAD USD/CAD" title="USD/CAD" width="600" height="600">
The pair maintained stability with daily closing below 0.9980 this week from which we expect the downside move to remain valid. Stochastic is trading in oversold areas which limit the downside waves but stability below the mentioned level will keep the bearishness of the negative Butterfly Pattern intact.
The trading range for today is among the key support at 0.9825 and key resistance at 1.0135.
The short-term trend is expected to the downside with daily closing below 1.0125 targeting areas of 0.9400. 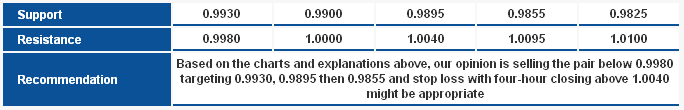 USD/CAD_S&R" title="USD/CAD_S&R" width="684" height="110">
AUD/USD AUD/USD" title="AUD/USD" width="600" height="600">
The pair returned above the second target of the bullish Butterfly Pattern at 1.0390 our intraday barrier for today; stability above which will trigger new attempts to return above the main ascending support and eying next a breach of the first extend harmonic target at 1.0420. Stability above 1.0300 makes us hold onto the positive outlook.
The trading range for today is expected among the key support at 1.0300 and resistance at 1.0505.
The short-term trend is to the downside targeting 0.9400 with steady daily closing below 1.0710. 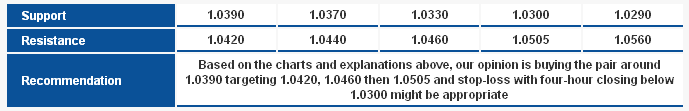 AUD/USD_S&R" title="AUD/USD_S&R" width="689" height="111">
NZD/USD NZD/USD" title="NZD/USD" width="600" height="600">
Over four-hour basis the pair is stable between the Linear Regression Indicators but trading with an upside bias. The pair is also holding above the critical barrier at 0.8100 and therefore we expect an upside move to test 0.8205 a breach of which might form an Inverted Head & Shoulders.
The trading range for today is expected among the key support at 0.8080 and resistance at 0.8310.
The short-term trend is to the upside targeting 0.8400 with steady daily closing above 0.7930. 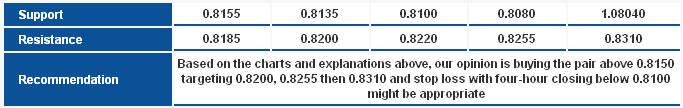 NZD/USD_S&R" title="NZD/USD_S&R" width="683" height="108">
Technical Crosses
GBP/JPY GBP/JPY" title="GBP/JPY" width="600" height="600">
The pair couldn`t stay above the "C" top of the bullish Harmonic Bat pattern, where it reversed to the downside from the bullish wave resistance. Stochastic is entering overbought areas, therefore, we do not exclude a downside correction unless yesterday's top at 132.36 is breached. We can't bet on the continuation of the bearish correction but we do consider it temporary.
The trading range expected for today is between the key support at 129.05 and the key resistance at 133.55 .
The short-term trend is to the downside targeting 112.00 as far as 150.00 remains intact. 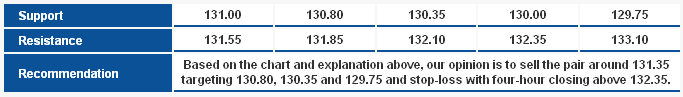 GBP/JPY_S&R" title="GBP/JPY_S&R" width="683" height="97">
EUR/JPY EUR/JPY" title="EUR/JPY" width="600" height="600">
The ascending channel's main upside support is still intact as shown in the chart, and despite the negativity on the Linear Regression Indicators we still expect a new bullish attempt to stabilize above 106.25 supported by the ascending channel. Relative Strength Index (RSI) is intact above 50 points as well as Stochastic, supporting our expectations for today.
The trading range expected today is between the key support at 104.60 and the key resistance 108.30.
The short-term trend is to the upside targeting 109.15 as far as 98.75 remains intact at week's closing.  EUR/JPY_S&R" title="EUR/JPY_S&R" width="683" height="97">
EUR/GBP EUR/GBP" title="EUR/GBP" width="600" height="600">
Four-hour closing above 0.8070 thwarted the negative expectations we have mentioned in several previous reports. However, we pointed out that it could set up an Inverted Head and Shoulders pattern, which is what happened. The chart shows the features of a classic bullish harmonic pattern, and despite being a non-idyllic setup because it was formed after a short bearish wave in terms of size, we will adopt it to forecast further bullishness as far as 0.8030 remains intact.
The trading range expected for this week is between the key support at 0.7925 and the key resistance 0.8165.
The short-term trend is to the upside targeting 1.0370 as far as 0.7785 remains intact. 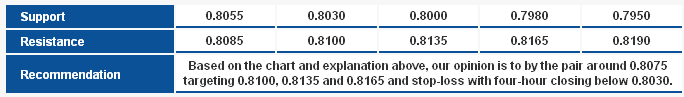 EUR/GBP_S&R" title="EUR/GBP_S&R" width="684" height="97">