EUR/USD setting up for a large move
The currency pair posted humble gains in the morning and continues to stay above a major static support. EUR/USD has signalled an exhaustion in the last days, but maintains a bullish perspective on the short term because is located above some important support levels.
The USDX moves sideways on the Daily chart and is waiting for a bullish spark today from the United States data. Only a dollar index rally could force the EUR/USD to start a broader leg lower in the upcoming weeks.
The Euro-zone is to release the Trade Balance later, the surplus could increase to 20.3B from 19.6B in May, while the Italian Trade Balance is expected to decrease from 3.60B t0 2.43B, but don’t think that will have a significant impact. Everyone is focusing on the US economic numbers, which will bring a high volatility in the afternoon.
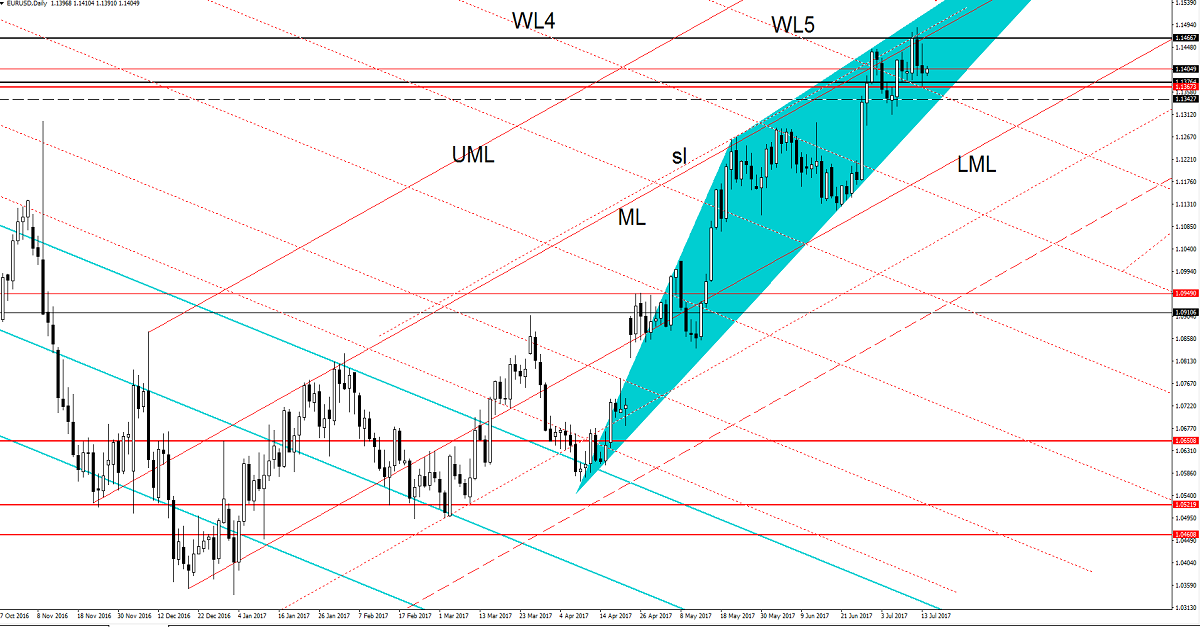
Price increased and is trading much above the 1.1376 major static support (resistance turned into support), could move sideways in the upcoming hours. We had a false breakdown below the 1.1376 level, actually has closed much above this downside obstacle, signalling that the bulls are very strong.
Technically the price has shown some overbought signs, but I want to remind you that the fundamental factors will take the lead and will drive the pair, the direction is uncertain.
A valid breakdown below the 1.1376 will open the door for more declines and the Rising Wedge pattern will be confirmed, while a valid breakout above the 1.1466 static resistance will signal a further increase in the upcoming period.
EUR/GBP false breakout?
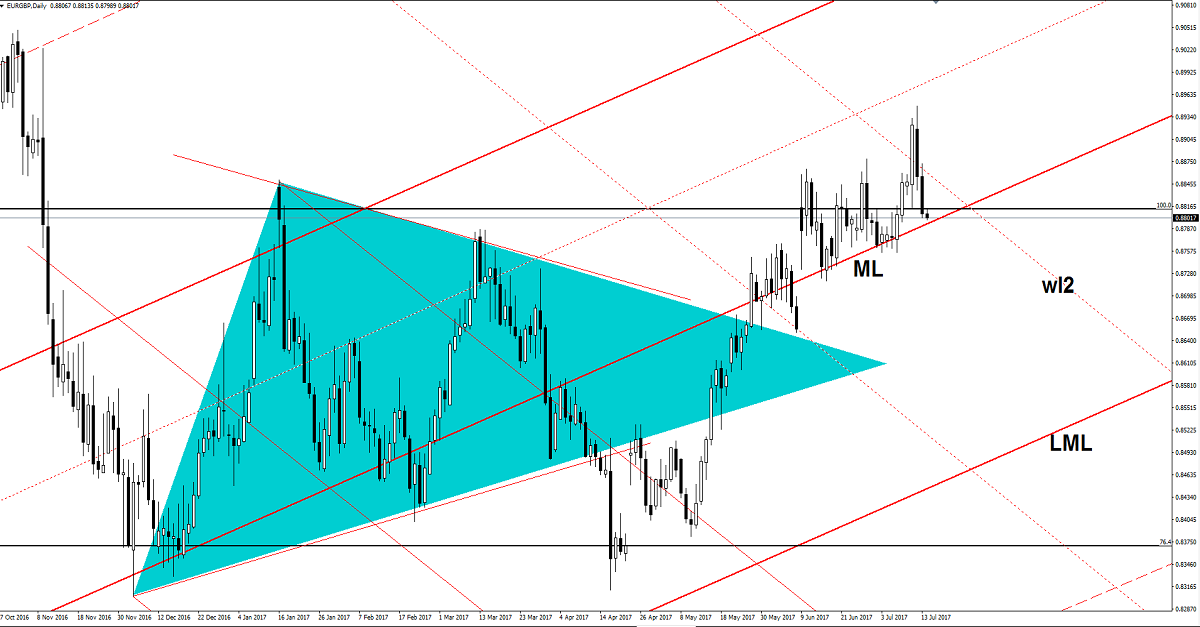
EUR/GBP dropped aggressively in the last two days and invalidated a breakout above a strong dynamic resistance. Right now is pressuring an important dynamic support, looks determined to ignore this obstacle. Is trading right above the 0.8800 psychological level, a valid breakdown below this level will attract more sellers, which will drive the price towards 0.86, 0.8550 levels.
Is trading in the red after the impressive sell-off, could drop further after the false breakout above the second warning line (wl2) of the minor descending pitchfork. We’ll have a selling opportunity only if will slip below the median line (ML) and if will retest this line.
A valid breakdown below the median line (ML) will invalidate the breakout above the 100% Fibonacci level and from the extended sideways movement. The bullish perspective remains intact as long as the ML is unharmed.
EUR/JPY – buying opportunity?
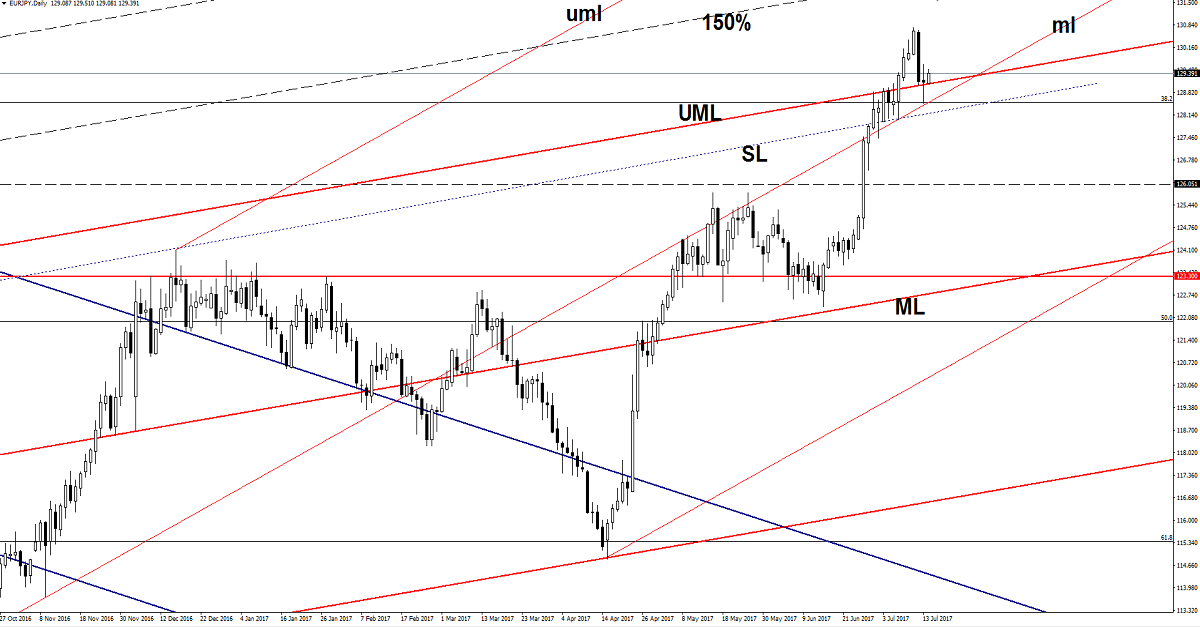
Looks like that the minor retreat is completed and could jump higher again in the upcoming period. EUR/JPY has found strong support at the upper median line (UML), a rejection here will send it much above the 130.00 psychological level, but personally I’m waiting for a confirmation that will really resume the upside movement. We’ll have a great buying opportunity from the confluence area formed at the intersection between the UML wil the median line (ml) of the minor ascending pitchfork, the first upside target will be at 130.75 previous high.


