FUNDAMENTAL OUTLOOK:
This week the dollar will be trading sideways between 1.0520 – 1.0780, because of a lack of important news. Now the market is waiting for a Trump speech about the future of new tax rates for business, which will happen on 28 February.
On Wednesday we have FOMC Meeting Minutes, which will predict the future of Fed % rate, but as Yellen said previously in congress:
Futures of new business tax rates is now most important for Fed and we need to include them in our future policy.
Also last week we had very positive news for % rates increasing as U.S. CPI, that, as a result, it is increasing faster than expected. But at the same time the dollar started to fall, because EUR/USD was trading on main support level 1.0520 (as I pointed in previous forecast) and the market had a strong technical rebound up to main resistance 1.0780 – 1.0830.
Any news before Trump's new tax policy market is being ignored and will continue to be trading sideways in the range 1.0520 – 1.0780. So we need to wait for Trump's result and then make a decision about a clearer dollar future, that we will see in a new forecast next week.
Important news of this week:
MONDAY
- U.S. holiday
TUESDAY
- GBP BoE Gov Carney Speaks
WEDNESDAY
- GBP GDP
- EUR, CPI
- U.S. FOMC Meeting Minutes
THURSDAY
- Crude Oil Inventories
FRIDAY
-
TECHNICAL FORECAST
EUR/USD
Main scenario:
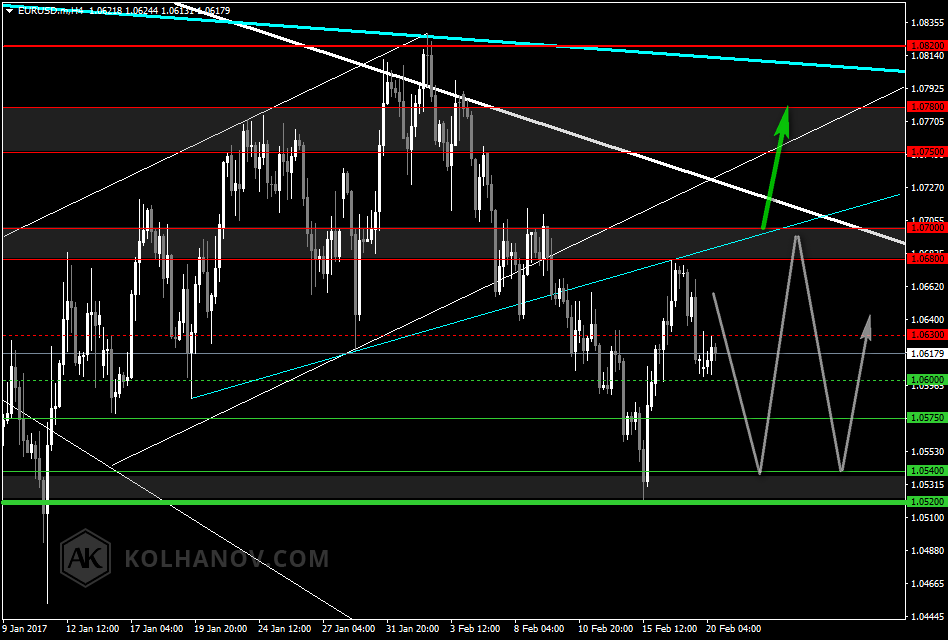
The market is trading along a huge sideways trend between support 1.0520/40 and resistance 1.0680/0700. Now we can expect continuation of correction to support level 1.0540.
Alternative scenario:
An uptrend will start as soon as the market rises above resistance level 1.0700, which will be followed by a move up to resistance level 1.0750/80.
The previous forecast: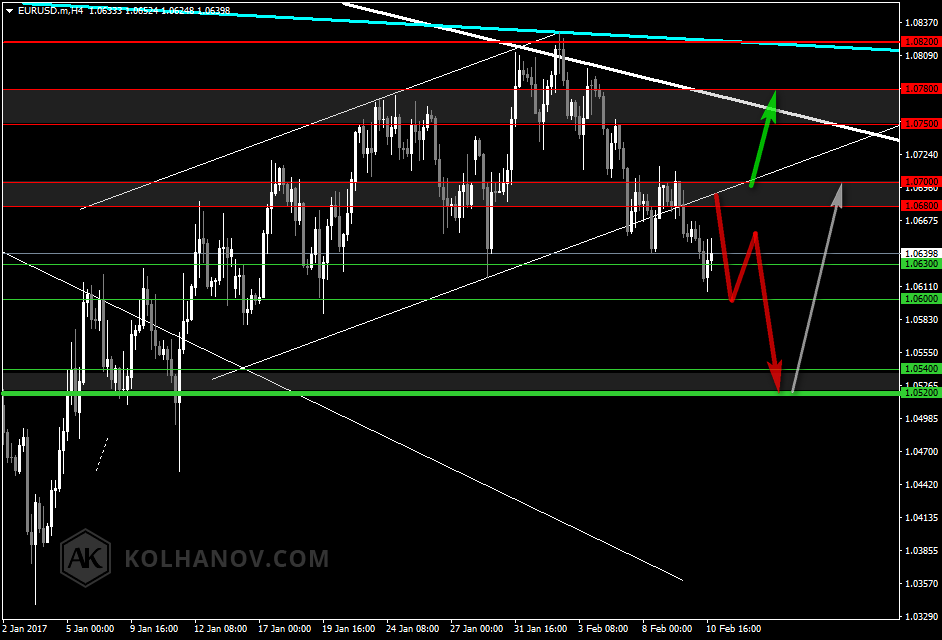
GBP/USD
Main scenarion:
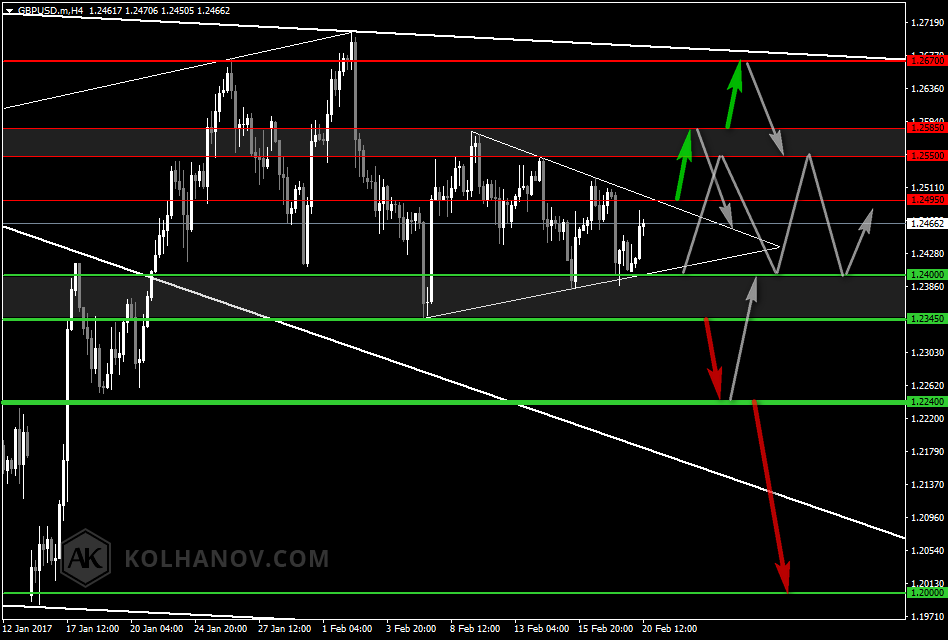
The market is trading along a sideways trend between support 1.2345/2400 and resistance 1.2550/85. Local uptrend will start as soon as the market rises above resistance level 1.2495, which will be followed by a move up to resistance level 1.2585
Alternative scenario:
An downtrend will start as soon, as the market drops below support level 1.2345, which will be followed by a move down to support level 1.2240 and if it keeps on moving down below that level, we may expect the market to reach support level 1.2000.
The previous forecast: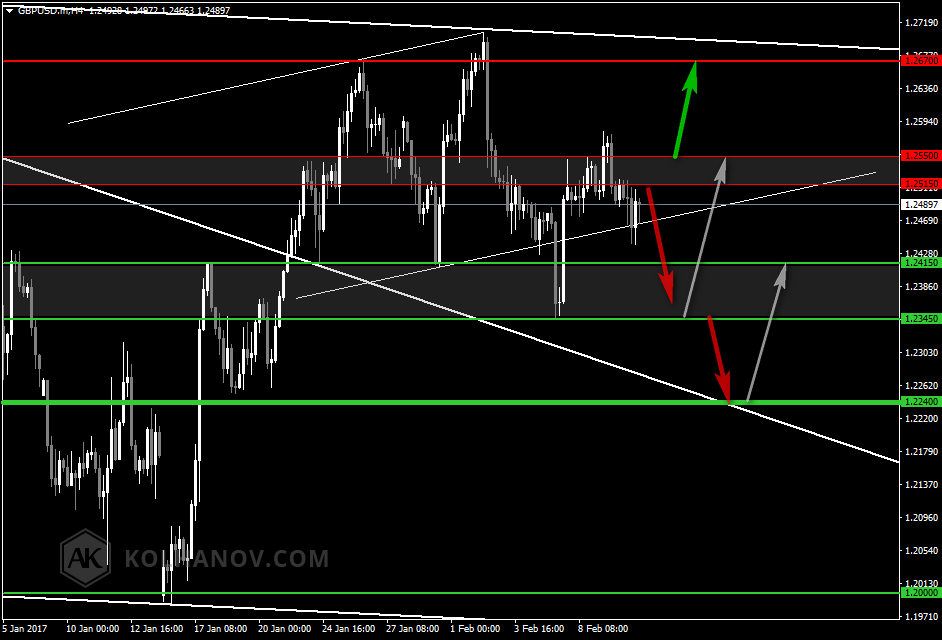
EUR/GBP
Fundamental outlook:
The pound will be trading sideways, because BoE can’t made any decisions about the future of financial policy without a clear picture in politics. And to allow this transparency a new trade agreement should be signed, but that will be possible to do only after the completion of Brexit, after article 50.
The Euro at the same time still does not have a straight way in its development, because of QE continuation, so also have a negative pressure. EUR/GBP will start a trend only in case of changes in above news, but for that it will be trading in a range of 0.8460 – 0.8640.
Main scenario:
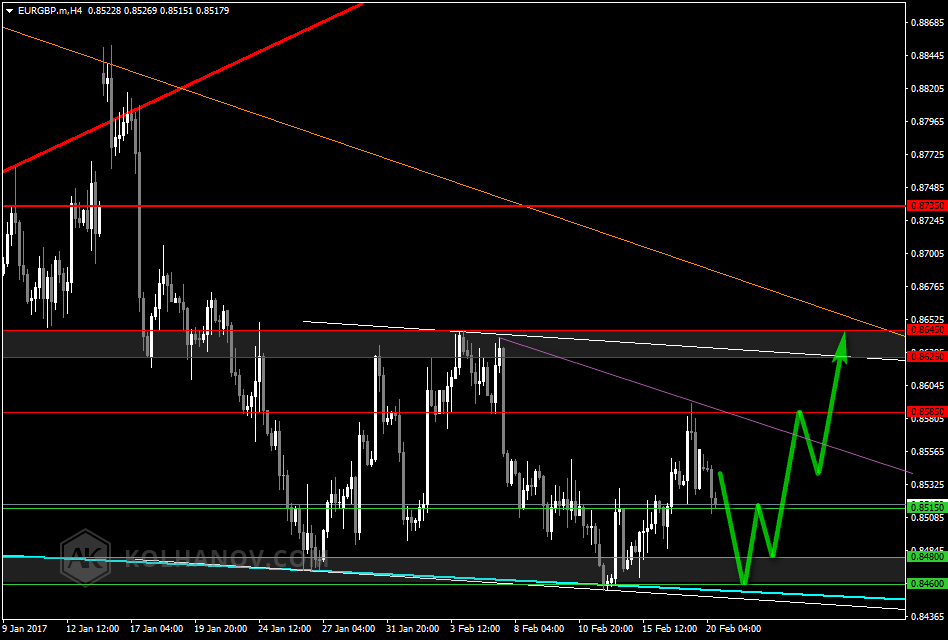
The market is trading along a sideways trend between support 0.8460/80 and resistance 0.8585, 0.8625/45. We can expect the start of an uptrend from support 0.8460 to resistance 0.8585.
Alternative scenario:
An downtrend will start as soon as the market drops below support level 0.8460, which will be followed by a move down to support level 0.8380.
The previous forecast: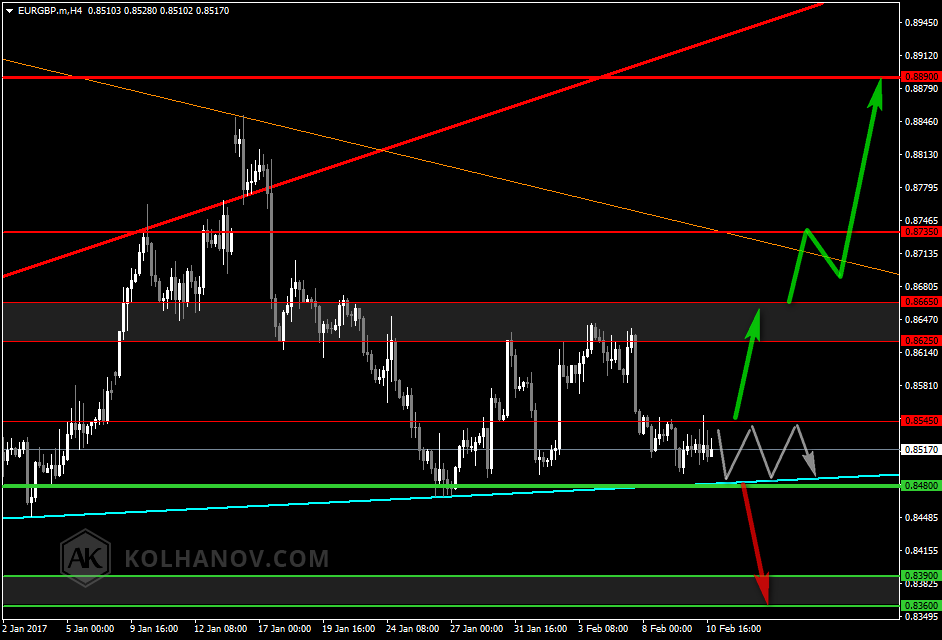
GOLD
Fundamental outlook:
Before Trump's tax news on February 28, the market will continue to be trading sideways in the current range.
Main scenario:
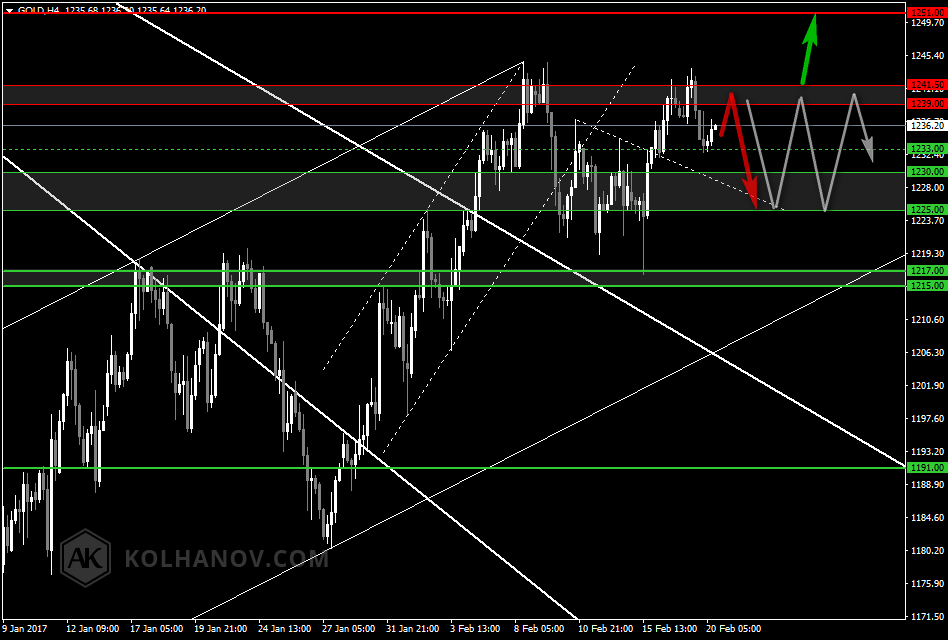
The market is trading along a sideways trend between support 1225/30 and resistance 1239/41. The start of a local downtrend we can expect from resistance 1241, which will be followed by a move down to support level 1225.
Alternative scenario:
The uptrend may be expected to continue in case the market rises above resistance level 1241, which will be followed by reaching resistance level 1251.
The previous forecast: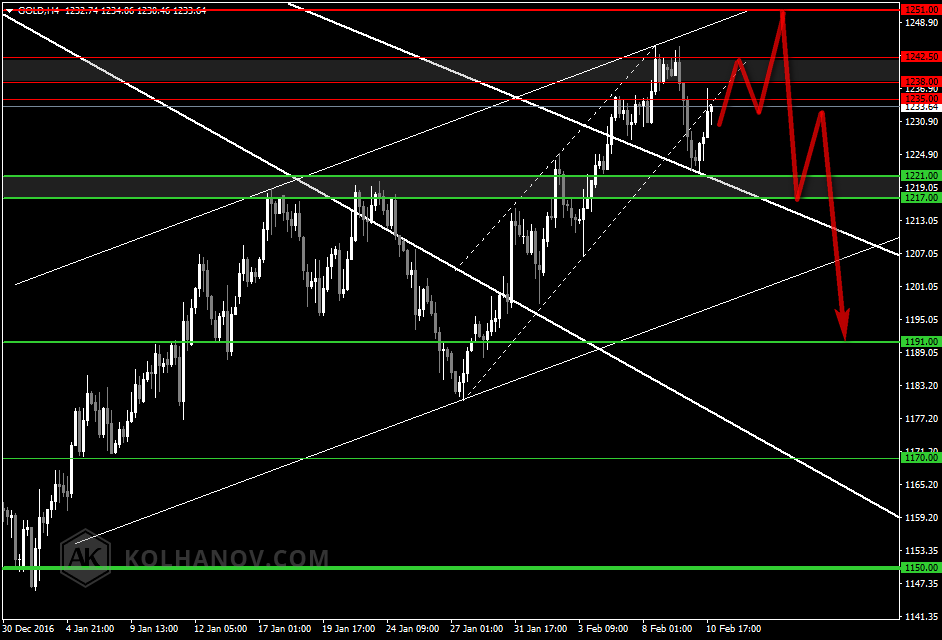
U.S. OIL
Fundamental outlook:
OPEC fulfilled its agreement on the permanent reduction of production by 90% and while the U.S. continues to increase the volume of oil rigs, it follows market to the balance and trade is going sideways between the resistance 54.85 and support 52.50. Exit from this range is possible in the case of changeos of OPEC policy or with the arrival of spring (April), when fuel demand is increases.
Main scenario:
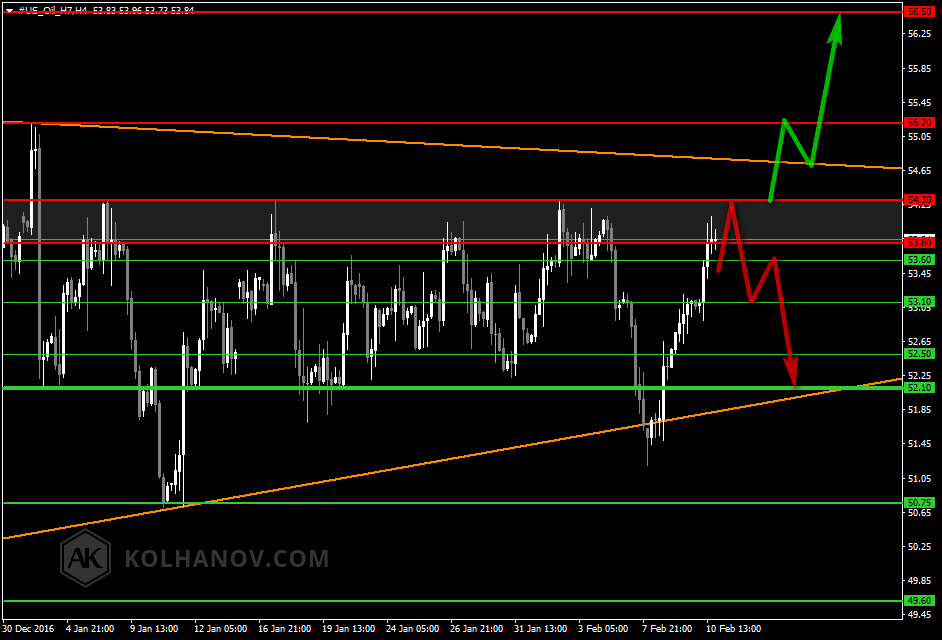
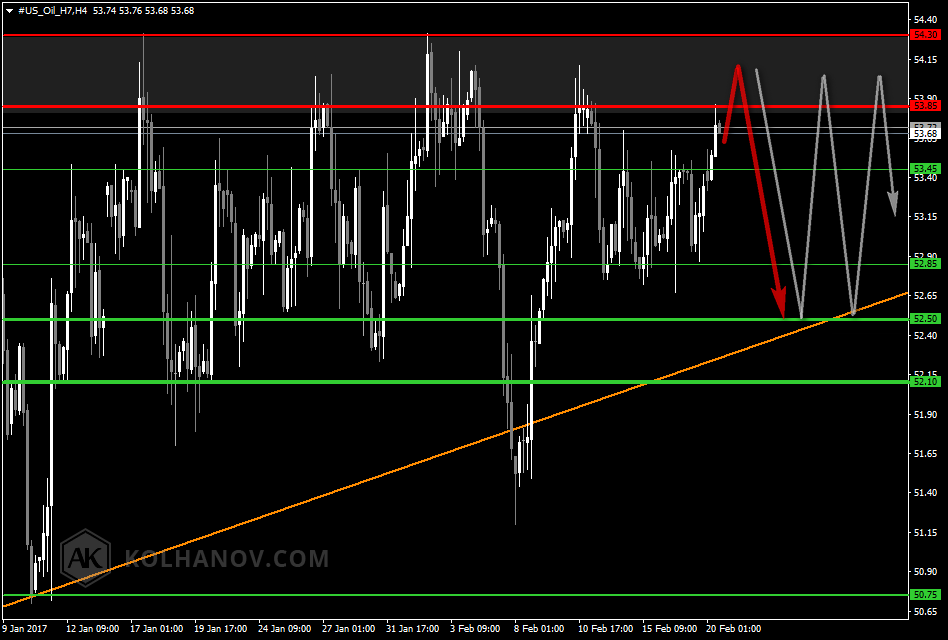
The market is trading along a sideways trend between resistance 53.85/54.30 and support 52.50, where local downtrend is trarting from resistance 53.85 with target on support 52.50.
Alternative scenario:
An uptrend will start as soon as the market rises above resistance level 54.30, which will be followed by a move up to resistance level 55.20 and 56.50.
The previous forecast: