Get 40% Off
🚨 Volatile Markets? Find Hidden Gems for Serious OutperformanceFind Stocks Now

Etsy Stock: The Easy Money’s Been Made Already

Published 01/18/2019, 07:21 AM
Updated 07/09/2023, 06:31 AM

Three years ago, in January 2016, Etsy (NASDAQ:ETSY) stock fell to as low as $6.04 a share. Yesterday, it closed at $54.59 a share.

If you have been among the lucky few, who happened to pick the bottom and held until now, your annual compounded rate of return would be over 108% per year or 803% in total. But don’t worry, if you didn’t – we missed that train, as well.

The thing is that according to fundamental valuation ratios like P/E, P/FCF or P/B, Etsy stock has been grossly overpriced the whole time. Yet, it simply kept on rising for three years.

The company’s profits and cash flows are too small to justify its $6.6B market cap, which means pure optimism has been the rally’s main fuel. So, in order to find out if ETSY still holds promise as an investment, we cannot rely on fundamental analysis.

Etsy Stock – the Elliott Wave View

In Elliott Wave analysis, on the other hand, market psychology plays a central role. It forms repetitive price patterns, which help us identify our place in the market cycle.
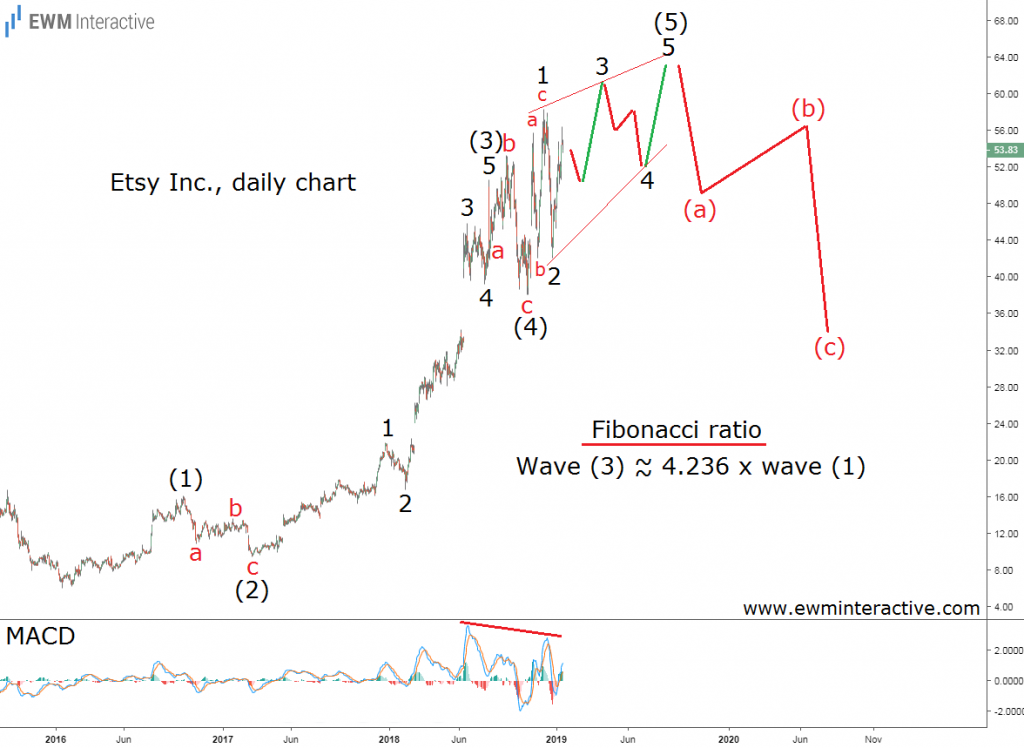
Etsy Stock Daily Chart Elliott Wave Forecast

The daily chart above reveals Etsy stock’s entire uptrend from the bottom at $6.04 three years ago. It looks like a five-wave impulse, labeled (1)-(2)-(3)-(4)-(5), where wave (3) is extended. The market has also obeyed the guideline of alternation, since wave (2) is a zigzag, while wave (4) is an expanding flat correction.

The rally from the bottom of wave (4) to the latest all-time high of $58.30 has been limited to just three waves. This makes us think wave (5) is still in progress as an ending diagonal, whose wave 3 is currently developing.

3rd party Ad. Not an offer or recommendation by Investing.com. See disclosure here or remove ads .

If this count is correct, we can expect a couple of new highs in wave (5), but nothing as spectacular as the past couple of years. A three-wave correction follows every impulse. Once wave (5) is over, a 50% selloff would be a real danger.

In addition, there is a bearish MACD divergence between waves (3) and (5), which is another evidence of the bulls’ fading strength. The easy money has already been made in Etsy stock. Caution is advised.

Original post

Latest comments

Risk Disclosure: Trading in financial instruments and/or cryptocurrencies involves high risks including the risk of losing some, or all, of your investment amount, and may not be suitable for all investors. Prices of cryptocurrencies are extremely volatile and may be affected by external factors such as financial, regulatory or political events. Trading on margin increases the financial risks.
Before deciding to trade in financial instrument or cryptocurrencies you should be fully informed of the risks and costs associated with trading the financial markets, carefully consider your investment objectives, level of experience, and risk appetite, and seek professional advice where needed.
Fusion Media would like to remind you that the data contained in this website is not necessarily real-time nor accurate. The data and prices on the website are not necessarily provided by any market or exchange, but may be provided by market makers, and so prices may not be accurate and may differ from the actual price at any given market, meaning prices are indicative and not appropriate for trading purposes. Fusion Media and any provider of the data contained in this website will not accept liability for any loss or damage as a result of your trading, or your reliance on the information contained within this website.
It is prohibited to use, store, reproduce, display, modify, transmit or distribute the data contained in this website without the explicit prior written permission of Fusion Media and/or the data provider. All intellectual property rights are reserved by the providers and/or the exchange providing the data contained in this website.
Fusion Media may be compensated by the advertisers that appear on the website, based on your interaction with the advertisements or advertisers.
© 2007-2024 - Fusion Media Limited. All Rights Reserved.