The Ethereum (ETH) price increased throughout the weekend. However, it did not reach a high above those reached on May 30. Also, it is possibly creating a head and shoulders pattern.
Where may the Ethereum price go next? Keep reading below in order to find out.
Ethereum Price (ETH): Trends and Highlights for June 17
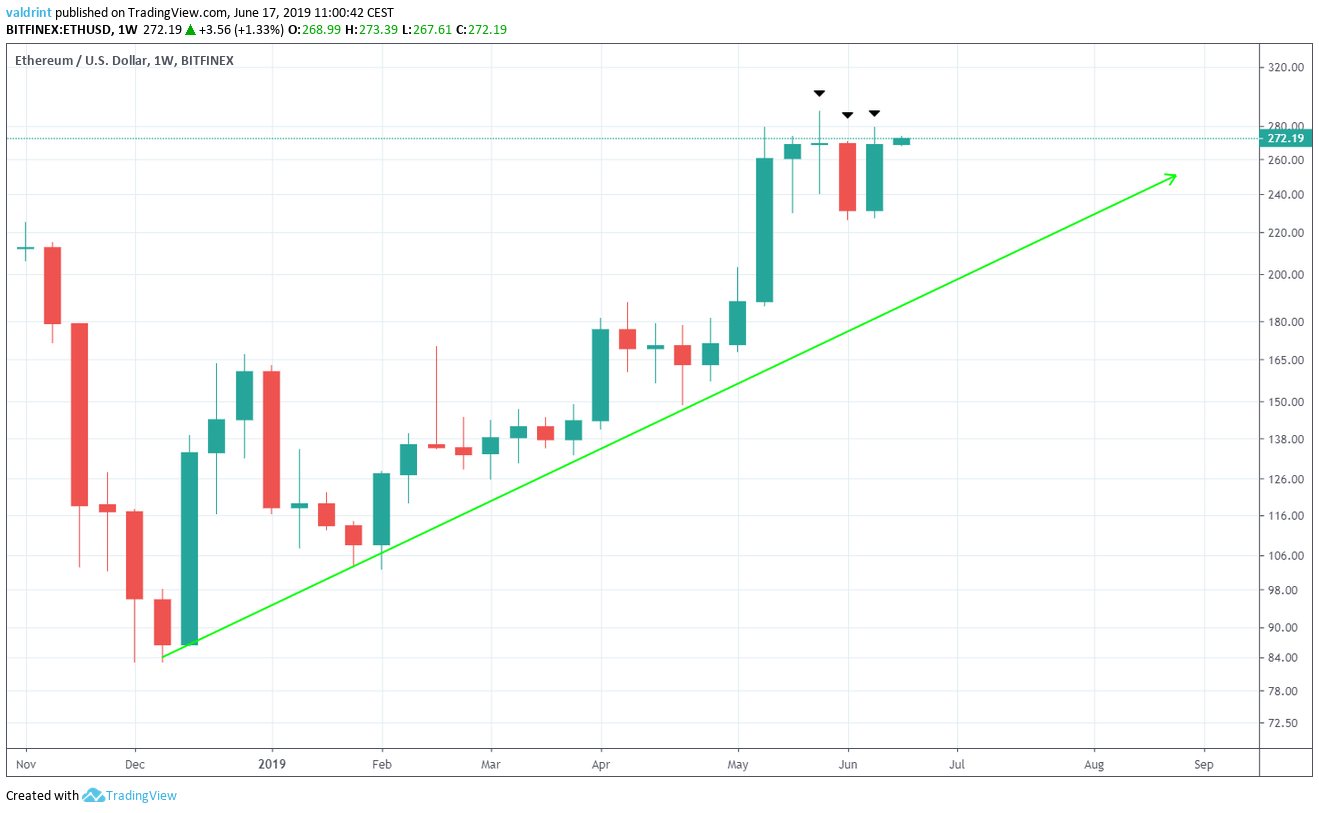
- In a weekly time-frame, ETH/USD is possibly creating an evening star pattern.
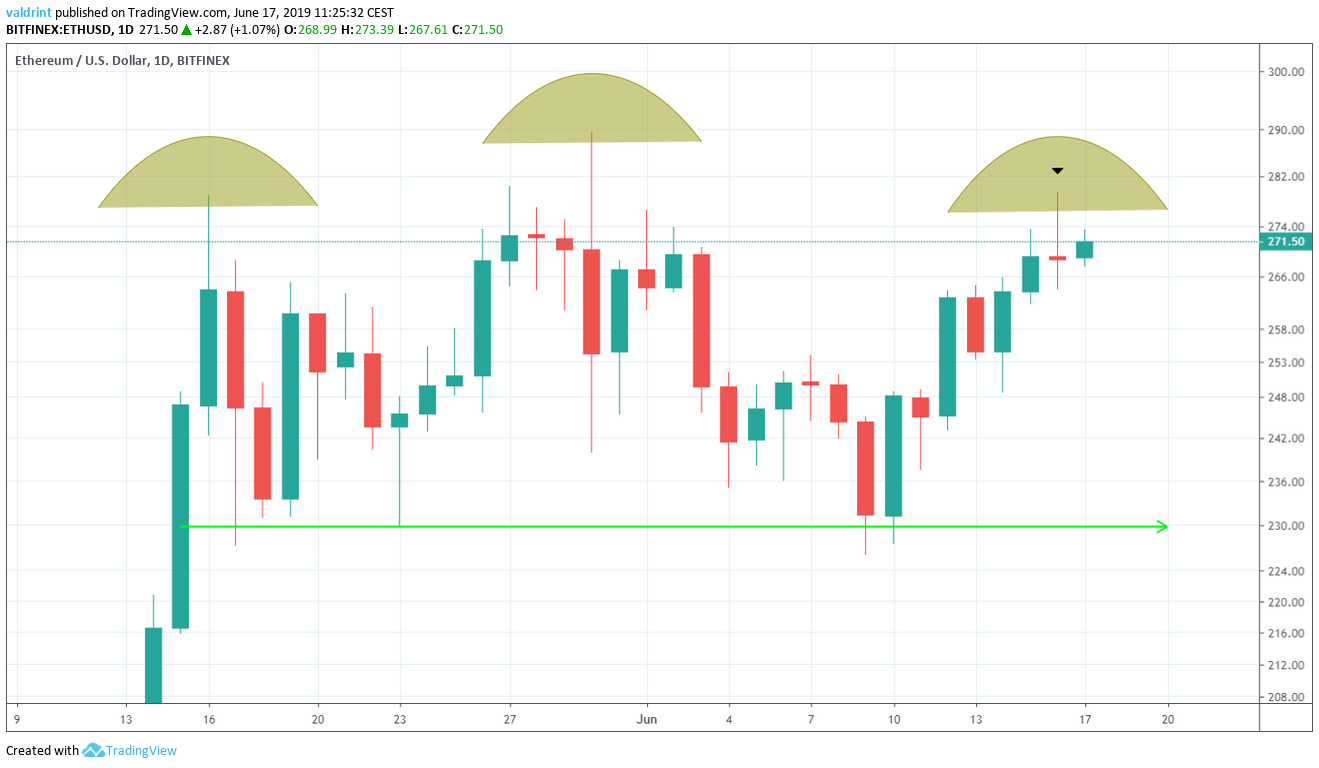
- It is currently on the right shoulder of a head and shoulders pattern.
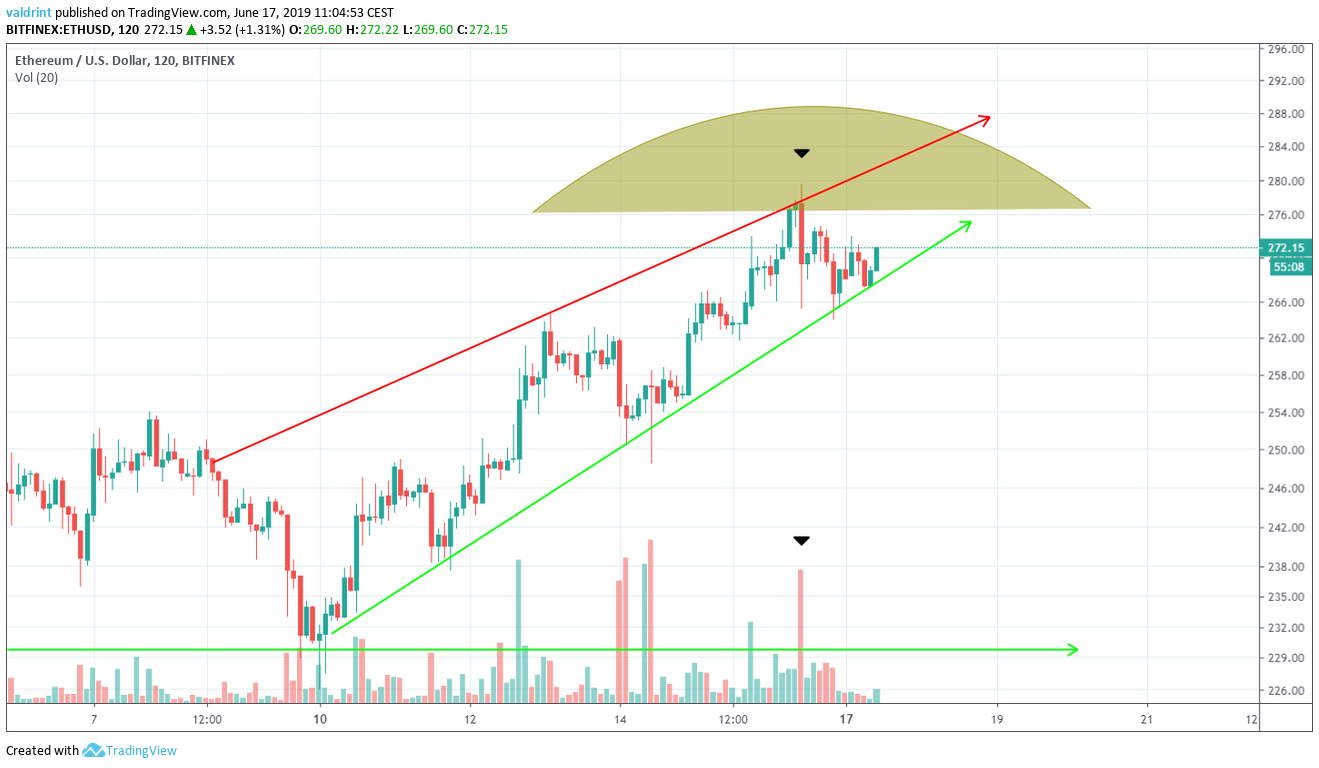
- It is trading inside a short-term ascending wedge.
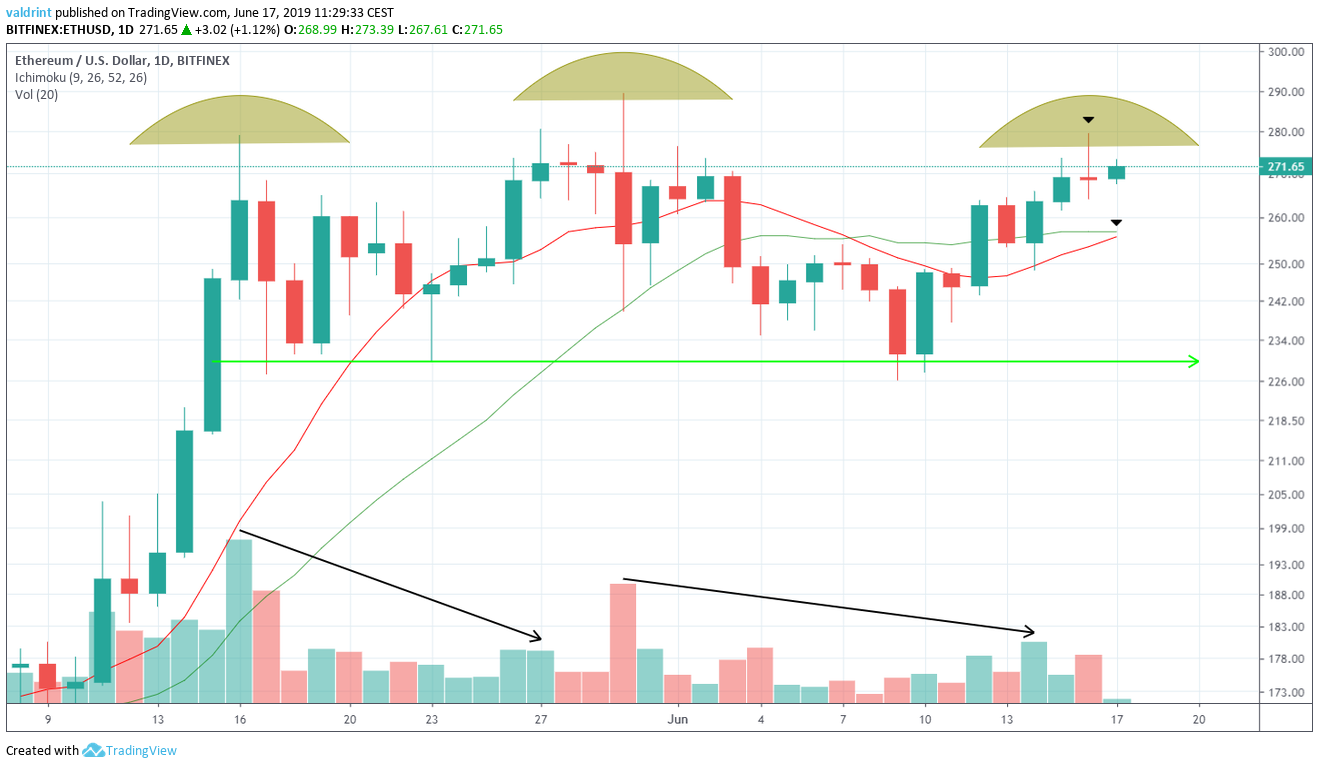
- Volume has been higher during decreases.
Weekly Time-Frame
The price of ETH is analyzed at weekly intervals from Nov 2018 to June 2019Since reaching lows near $85 at the beginning of Dec 2018, the Ethereum price has been on an uptrend. It has been following the ascending support line outlined below.

During the week of May 27 – June 03, the Ethereum price created a doji candle — which indicates that there is indecision in the market. This was succeeded by a bearish engulfing candle during the following week. These two candles display the characteristics of the beginning of an evening star, a bearish reversal pattern.
The candle for the previous week was a bullish one. However, it closed below the opening of the bearish engulfing candle of the week prior. This is in stark contrast with BTC, which created a bullish engulfing candle — invalidating the evening star pattern. Therefore, in the case of Ethereum, the possibility of a reversal preceded by an evening star is still in play.
ETH Price: Head And Shoulders
The Ethereum price is analyzed at two-hour intervals. Volume and the 10-, 20-period MAs are added in the second/third graphs.Since reaching a low of $228.5 on May 16, the Ethereum price has been following the horizontal support line outlined below:

Furthermore, it has created a possible head and shoulders pattern (H&S).
The left shoulder is created by highs on May 17 near $280. The head is created by the top of $290 on May 30. At the time of writing, the price is possibly creating the top of the right shoulder.
Also, the candle for June 16 was a bearish doji. When found in an uptrend, it is often a sign of reversal. If the ETH price were to make a bearish engulfing candle on June 17, closing below $260, it would likely create an evening star pattern. This decrease would possibly complete the same pattern in a weekly time-frame.
Furthermore, technical indicators support this decrease.

The volume characteristics have been standard for an H&S pattern. First, the volume in the advance of the left shoulder has been higher than the advance of the head.
Afterward, volume increased during the decline from the head. It remained low during the increase towards the right shoulder. If the price does indeed complete the pattern, the volume should be higher during the upcoming decrease.
Furthermore, the 10-day MA is close to crossing above the 20-day one. This is known as a bullish cross. It goes contrary to the hypothesis that an H&S pattern will be completed. Therefore, if the MAs reject this cross and continue to fall down, it would be the final confirmation that the pattern is going to be completed.
Ascending Wedge
Since June 10, the Ethereum price has been increasing, trading inside an ascending wedge.
The wedge coincides with the right shoulder from the previous section.

On June 16, the ETH price reached highs near $280. A rapid decrease began. The price created a massive bearish engulfing candle. Additionally, this decrease was combined with significant volume. Combined with the fact that the ascending wedge is a bearish pattern, it is likely that the price will begin to decrease.
This decrease would initiate the conclusion of the H&S pattern. If the Ethereum price completes this pattern and breaks down from the horizontal support line near $230, it will likely complete the evening star pattern outlined in the first section.
A high above $290 (the top of the head) would invalidate this pattern.
