It is no doubt that ever since the dawn of the blockchain technology in 2008, industries have been revolutionized by the uncontested decentralization, security and transparency it brings to traditional systems. The blockchain protocol, alongside its irrefutable cryptographic techniques, has provided solutions to the then-unsolvable problems of centralized systems, specifically when it comes with trust and privacy. This is the very reason why the blockchain itself has found its way from the most basic industries such as cryptocurrency, money transfer, and data networks, up to the most complex such as DNA databanks, and AI consciousness clouds. Imagination is the limit when it comes with the versatility of the nascent tech.
Even the gambling industry is on the ball to adopt promising blockchain technology. So without further ado, let’s start with the technical analysis on TrueFlip coin and Ethereum.
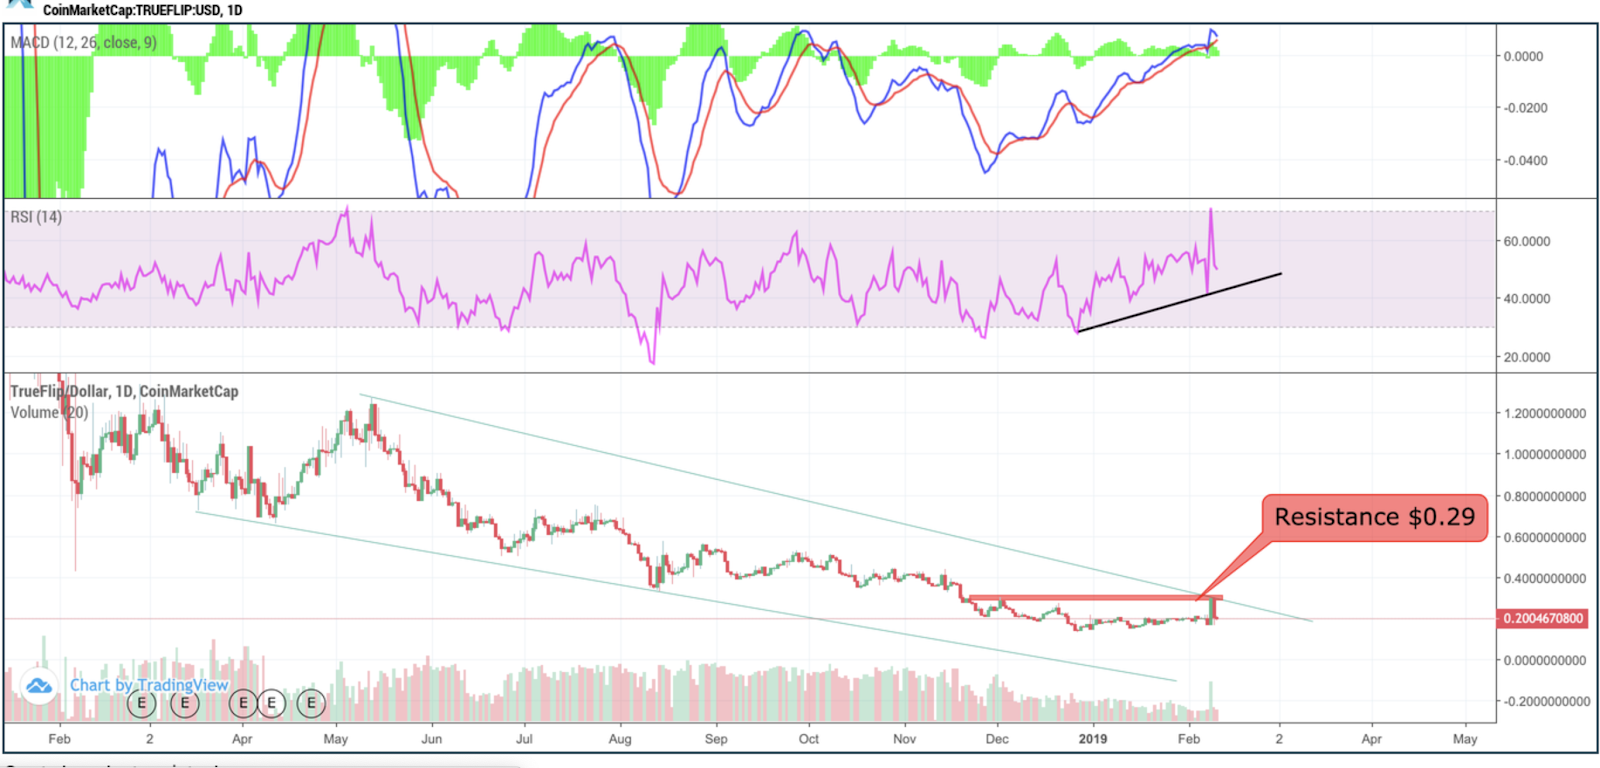
TFL/USD Daily Chart
TFL declined 98 percent to date. It is in an ongoing downward channel and was recently rejected by the resistance at $0.29. The MACD remains bullish and the recent surge came with the largest buy volume in the last 60 days.
Another interesting blockchain project in said industry is Faireum which aims to revolutionize the way users experience online gambling with the innovations brought by their very own independent blockchain technology which comes with remarkable low fees.
As the development of their ecosystem continues, Faireum plans to release software development kits (SDKs) in the near future. This is for online casino proprietors to be able to adopt Faireum’s official blockchain-based games as well as creating their own games built on top of Faireum’s blockchain, bringing useful blockchain applications into being that are sustainable regardless of the cryptocurrencies market behavior.
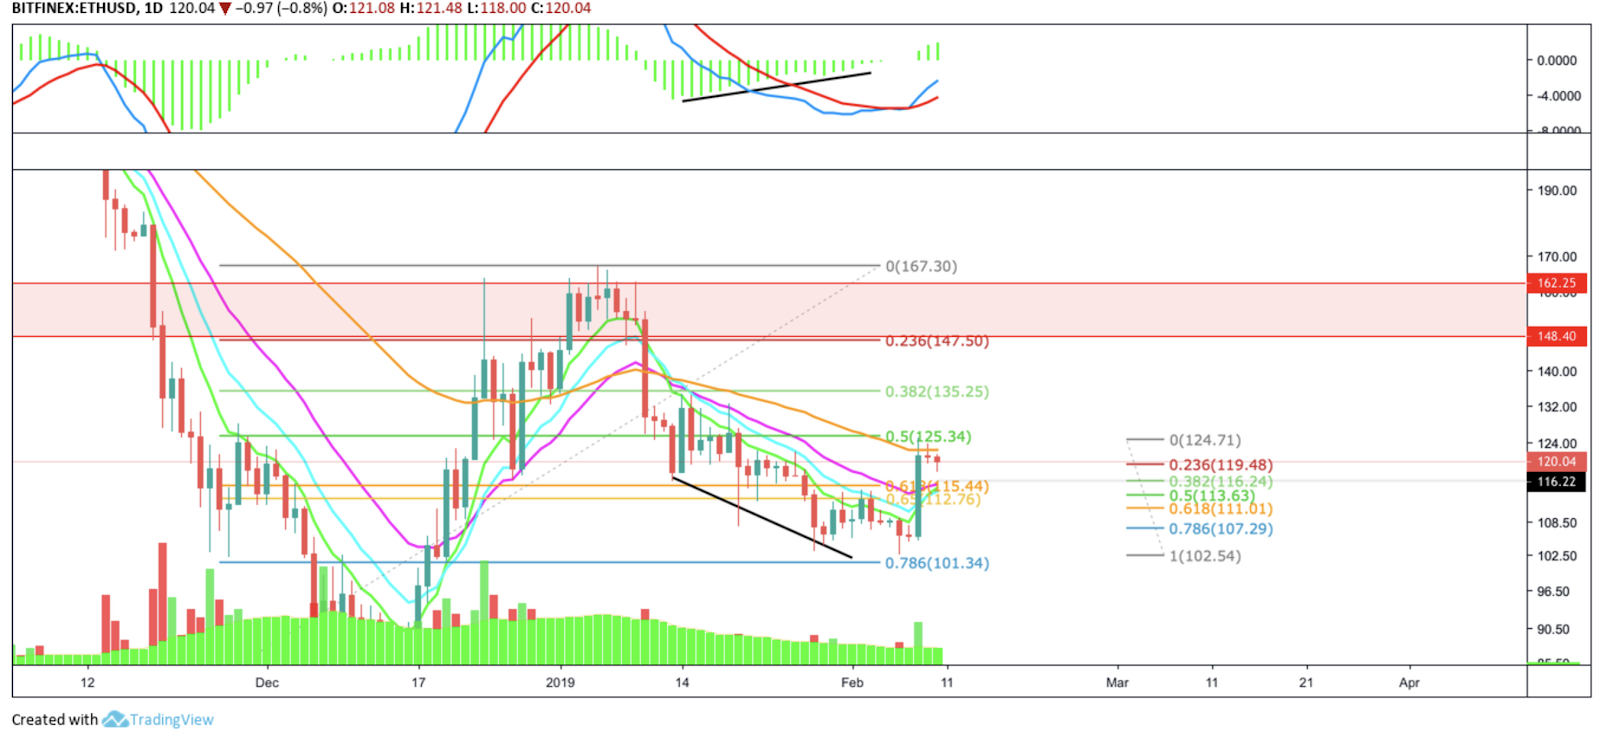
ETH/USD Daily Chart
Ethereum declined 17 percent during the last two weeks but recovered the losses on the 8th of February, where it rose by 18 percent in one day. Recently forming bullish divergences in the MACD, Ethereum had good chances for a price correction towards the upside. With being rejected by the 0.5 fib level where the 50-day EMA acted as additional resistance, Ethereum is most likely heading to the $116 mark where the 0.38 fib level and the 21-day-EMA act as short-term support. If it bounces off this level, we could assume further upward movement which could result in a re-test of the major resistance at around $150, which is additionally a psychological key level. However, if it falls below $111, chances are high that Ethereum continues its bear trend. Assuming bearish momentum, the next major support is located between $68 and $85.


