
General Electric (NYSE:GE) , a giant in the U.S. industrials sector, released its second-quarter 2017 earnings on July 21, 2017. The company’s oil and gas division witnessed a decline in revenues primarily due to volatile oil prices. Moreover, uncertainty around President Donald Trump’s pro-growth policies has created a cloud over the outlook on the industrial sector.
Q2 Results in Focus
Shares of General Electric Company declined more than 3.1% at market close on July 21, 2017, despite beating the Zacks Consensus Estimate on both earnings and revenues (read: US Trade Deficit Declines in May: ETFs in Focus).
The company’s revenues decreased 11.75% in second-quarter 2017 on a year-over–year basis. However, revenues increased 6.86% on a sequential basis. Revenues of $29.558 billion came ahead of the consensus mark of $29.123 billion.
General Electric reported non-GAAP earnings per share (EPS) of $0.28 for second-quarter 2017, down 45% year over year but up 33.33% on a sequential basis. It came ahead of the Zacks Consensus Estimate of $0.25. Moreover, GE continues to expect its full-year 2017 EPS to be in the range of $1.60–$1.70, but stated that the company is trending towards the bottom end of the guidance.
The company reported earnings from continuing operations attributable to GE common shareowners of $1.338 billion, down from $3.300 billion a year ago. Second-quarter 2017 orders increased 6% to $28.3 billion, from $26.6 billion a year ago. Moreover, GE’s backlog increased 2% to $326.8 billion from $319.6 billion a year ago.
Revenue Performance
Industrial segment revenues decreased to $28.047 billion from $28.630 billion in the year-ago quarter.
Power revenues increased to $6.969 billion from $6.639 billion in the year-ago quarter.
Renewable Energy revenues increased to $2.457 billion from $2.094 billion in the year-ago quarter.
Oil & Gas revenues decreased to $3.108 billion from $3.219 billion in the year-ago quarter.
Aviation revenues increased to $6.532 billion from $6.511 billion in the year-ago quarter.
Healthcare revenue increased to $4.700 billion from $4.525 billion in the year-ago quarter.
Transportation revenues decreased to $1.071 billion from $1.240 billion in the year-ago quarter.
Energy Connections & Lighting revenues decreased to $3.210 billion from $4.401 billion in the year-ago quarter.
Performance of General Electric has been dismal so far this year, as it is down 19.53% year to date (as of July 24, 2017).
In the current scenario, we believe it is prudent to discuss the following ETFs that have a relatively high exposure to General Electric (see all Industrial ETFs here).
Industrial Select Sector SPDR Fund XLI
This fund focuses on providing exposure to the U.S. industrial sector. It has AUM of $10.91 billion and charges a fee of 14 basis points a year. It has a 7.80% allocation to General Electric (as of June 30, 2017). The fund has returned 17.40% in the last one year and 10.30% year to date (as of July 24, 2017). It closed 0.51% higher on Friday, July 21, 2017. XLI currently has a Zacks ETF Rank of #3 (Hold) with a Medium risk outlook (read: Bet on Sector ETFs with Strong Beat Ratios).
Vanguard Industrials ETF (MC:VIS)
This ETF is a pure play on the U.S. industrials sector. It has AUM of $3.2 billion and charges a fee of 10 basis points a year. It has a 8.6% allocation to General Electric (as of June 30, 2017). The fund has returned 16.38% in the last one year and 8.41% year to date (as of July 24, 2017). It closed 0.41% higher on Friday, July 21, 2017. VIS currently has a Zacks ETF Rank of #3 with a Medium risk outlook.
iShares U.S. Industrials ETF IYJ
This ETF is a relatively costly bet on the U.S. industrial sector. It has AUM of $1.05 billion and charges a fee of 44 basis points a year. It has a 7.40% allocation to General Electric (as of July 21, 2017). The fund has returned 16.48% in the last one year and 10.52% year to date (as of July 24, 2017). It closed 0.47% higher on Friday, July 21, 2017. IYJ currently has a Zacks ETF Rank of #3 with a Medium risk outlook.
Below is a year to date performance comparison of the funds and General Electric.
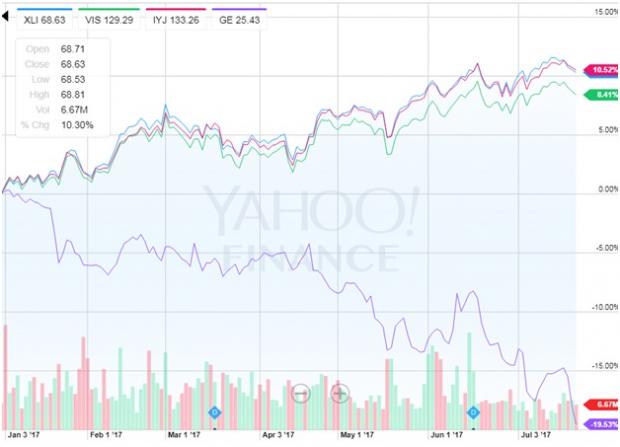
Source: Yahoo (NASDAQ:AABA) Finance
Want key ETF info delivered straight to your inbox?
Zacks’ free Fund Newsletter will brief you on top news and analysis, as well as top-performing ETFs, each week. Get it free >>
General Electric Company (GE): Free Stock Analysis Report
VIPERS-INDUS (VIS): ETF Research Reports
SPDR-INDU SELS (XLI): ETF Research Reports
ISHARS-US INDU (IYJ): ETF Research Reports
Original post
Zacks Investment Research