The world is awash in efforts to model a theoretical value for the stock market – the CAPE ratio, for example. But while the equities hog much of the attention on this front, similar analytics for the world’s most important interest rate are no less valuable.
How to begin? Not surprisingly, there are countless possibilities. Alas, time is short. Enter a model that generates a baseline estimate from analyst Tom Shevlin, who outlined the rationale and analytics in The Journal of Investment Management in 2019: “A Model of Bond Value: Explaining Yields With Growth and Inflation.”
Shevlin advises that the model seeks to “establish a new heuristic for investors, giving them a simple, intuitive way to relate bond yields to prevailing trends in growth and inflation.”
The model offers an alternative to forecasting surveys, which have been over-estimating 10-year Treasury yields for decades…. The model does well in in-sample and out-of-sample tests used in the literature to evaluate other measures of value. The model can be used on its own or in conjunction with other models to forecast yields and also as a benchmark to evaluate yield forecasts.
A key appeal is the parsimony and compelling intuition by assuming that much of what drives the 10-year rate is economic activity and inflation. Accordingly, the Shevlin model, as I’ll call it, is a two-factor design, using U.S. gross domestic product (GDP) and the consumer price index (CPI). The case for using this simple model, he explains, is that “in equilibrium, the marginal product of capital is equal to the natural growth rate. Firms would in all likelihood expect a return at least equivalent to the rate of GDP growth when choosing to undertake an investment.”
Otherwise they would seek investment opportunities elsewhere. Since the marginal product of capital will also be equal to the marginal cost of capital in equilibrium, this implies that the marginal cost of capital for the economy as a whole will equal the natural rate of growth. So as long as the marginal investor can borrow at or near the risk-free rate, then it is not unreasonable to expect real long-term rates and real GDP growth to gravitate toward each other over time.
Translating the concept into a model, Shevlin estimates the relationship as:
i10Y  ≈ g + π

Where:
i10Y ≡ nominal 10-year government bond yield

g ≡ real growth rate

π ≡ inflation

The model is useful as a first approximation — all the more so when you consider that complication in finance and economics has a mixed record, at best. While relatively complicated models can be useful, starting with a simple, robust foundation is recommended before building more elaborate structures.
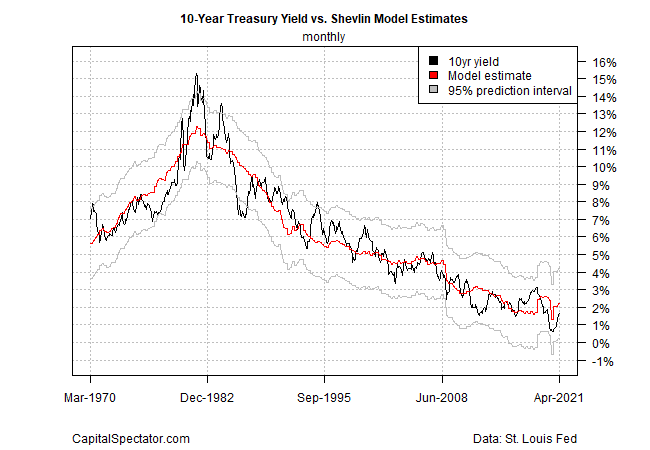
Using the paper as a guide, I coded up a version in R for some perspective on how the results stack up against the actual 10-year rate. The main result is shown in the first chart below:

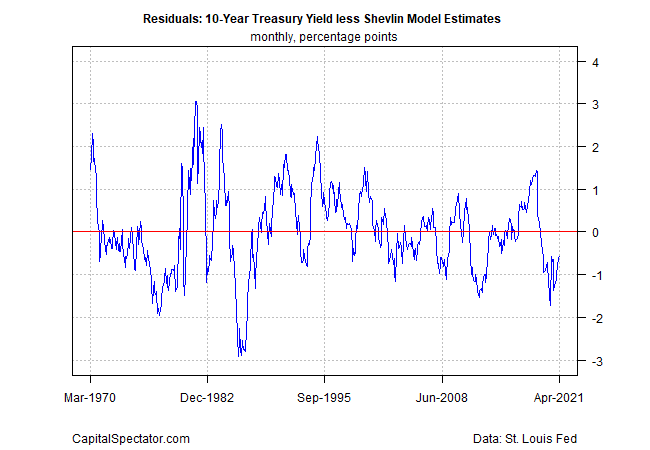
The model does a reasonable job of approximating the 10-year rate. Alas, it’s not perfect, as no model of the real world ever is. Nonetheless, using the output as a guide has obvious appeal for managing expectations. For example, when the actual 10-year rate is relatively wide of the model’s estimate, the spread provides a basis for a directional forecast. On that basis, here’s how the model’s residuals compare through time:

Note that in recent history the actual 10-year rate had fallen relatively steeply vs. the model estimate – an implied forecast that the 10-year rate was set to rise, the model’s estimates were set to fall, or some mix of both.
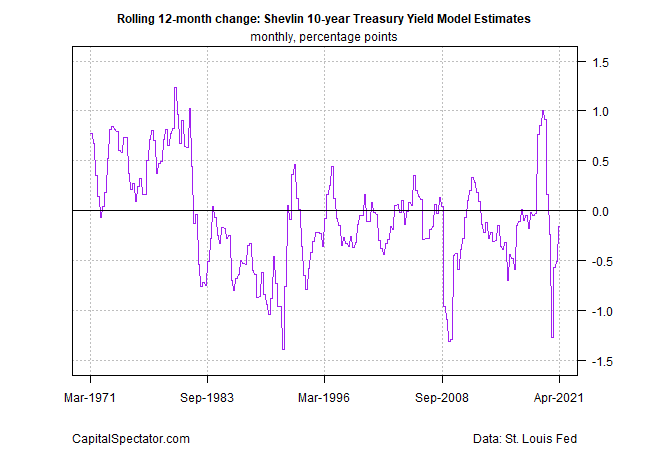
Another way to use the model for estimating the near-term future path of the 10-year rate: compare how the estimates change over the trailing one-year period. When the estimates have risen sharply, that’s a clue for thinking that an upside bias is building for the 10-year rate, and vice versa.

The results suggest that the model offers useful context for approximating an equilibrium value for the 10-year rate and making informed judgments about where this Treasury yield appears to be headed in the near term.
But as useful as this model is, the question arises: Can we do better? Using the Shevlin model as foundation, in future posts I’ll test variations by adding additional variables in an attempt to minimize the errors.
