
Although most EU stock indices traded in the green yesterday, the US and Asian ones slid as WTI plunged to negative waters for the first time in history. It seems that with storage tanks getting full, holders of May contracts preferred to sell instead of taking delivery. They may have been willing to pay other people than taking the burden of extra storage cost.
RISK ASSETS FALL, SAFE HAVENS GAIN AS WTI FALLS BELOW ZERO
The dollar traded higher against all but one of the other G10 currencies on Monday and during the Asian morning Tuesday. It gained the most versus NZD, AUD, CAD and NOK in that order, while it eked out the least gains against CHF. The only currency that managed to outperform the greenback was JPY.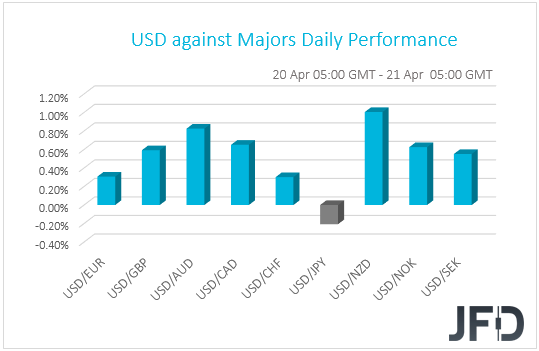
The relative strength of the safe havens, combined with the weakness in the commodity-linked and oil-related currencies, suggests that market participants traded in a risk-off manner yesterday. Indeed, although the majority of the EU indices closed in green territory, with investors perhaps cheering the latest slowdown in both infected cases and deaths due to the coronavirus, the US ones tumbled more than 1%. The Dow Jones fell the most, losing 2.44%. The negative morale rolled over into the Asian session today, with Japan’s Nikkei 225 and China’s Shanghai Composite sliding 1.96% and 1.26% respectively.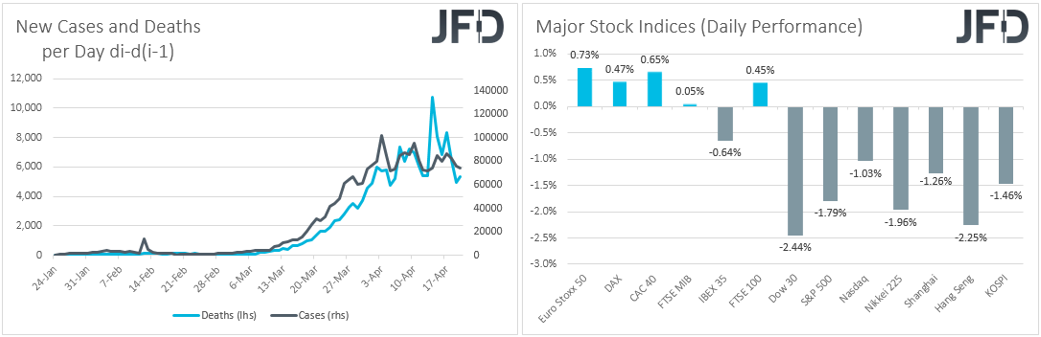
What turned things around may have been the plunge in oil prices into negative waters for the first time in history. WTI futures for May, due to expire today, settled at USD -37.63 yesterday, falling USD 55.90, and even sinking as low as USD -40.32. And the question now is: How is that possible? Following the coronavirus restrictive measures, billions of people have stopped travelling, resulting in supply levels well above those of demand. Consequently, storage tanks are getting full and thus investors holding May contracts preferred to get rid of them as they didn’t want take the burden of paying extra storage costs. They were willing to pay other people in order to take the contracts off their hands.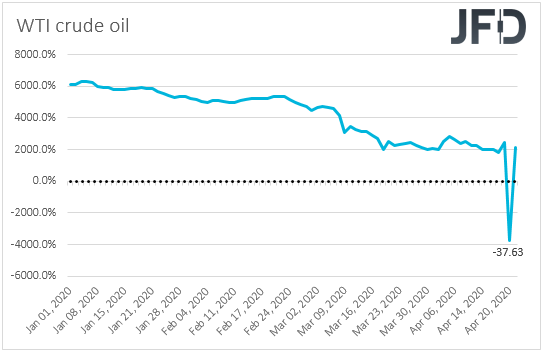
At this point, it is worth mentioning that the June contract is still trading above USD 20.00 a barrel, and that’s why the benchmark may have rebounded overnight. Having said that though, with the restrictive measures still intact around the globe, we cannot rule out another round of selling as demand remains subdued and storage space continues to diminish. Even if some nations decide to start loosening their lockdown restrictions, this may be a very slow procedure, and thus, demand is very unlikely to return to its pre-virus levels soon. With that in mind, we would expect the oil-related currencies CAD and NOK to stay under selling interest for a while more. Remember that the Canadian and Norwegian economies are dependent on oil production and exports.
As for the broader market sentiment, even if we see equities rebounding on further slowdown in the coronavirus cases, we will still be reluctant to trust a long-lasting recovery. As we noted last week, we prefer to take things day by day. Just a day of accelerating cases and deaths may be enough to revive fears and trigger another round of risk aversion. What’s more, there are still several data pending for the month of March, during which the virus spread at an exponential pace outside China. Thus, investors may get disappointed if upcoming economic releases reveal that the wounds are deeper than previously anticipated, and thereby reduce again their risk exposure.
USD/CAD – TECHNICAL OUTLOOK
USD/CAD traded higher on Monday after hitting support at the psychological 1.4000 barrier on Friday. Overall, the rate is trading above the prior downside resistance line drawn from the peak of March 19th, while since April 14th, it’s been printing higher highs and higher lows above a new short-term upside line. Thus, having these technical signs in mind, we would consider the near-term picture to be positive for now.
At the time of writing, the rate is trading near the 1.4181 level, marked as a resistance by Thursday’s high. A decisive break above that level would confirm a forthcoming higher high and may initially pave the way towards the high of April 2nd, at around 1.4296. If the bulls do not stop there, we could see them aiming for the 1.4428 zone, marked by an intraday swing high formed on March 25th. Another break, above 1.4428, could carry more bullish implications, perhaps opening the path towards the peak of March 24th, at around 1.4535.
In order to start considering the bearish case, we would like to see a strong dip below 1.3860, a support defined by the lows of April 13th and 14th. This would confirm a lower low on the daily chart and may allow the bears to dive towards the low of March 15th, at 1.3730. A break below 1.3730 may extend the slide towards the low of March 10th, at 1.3612, the break of which may target the low of the day before, near 1.3518.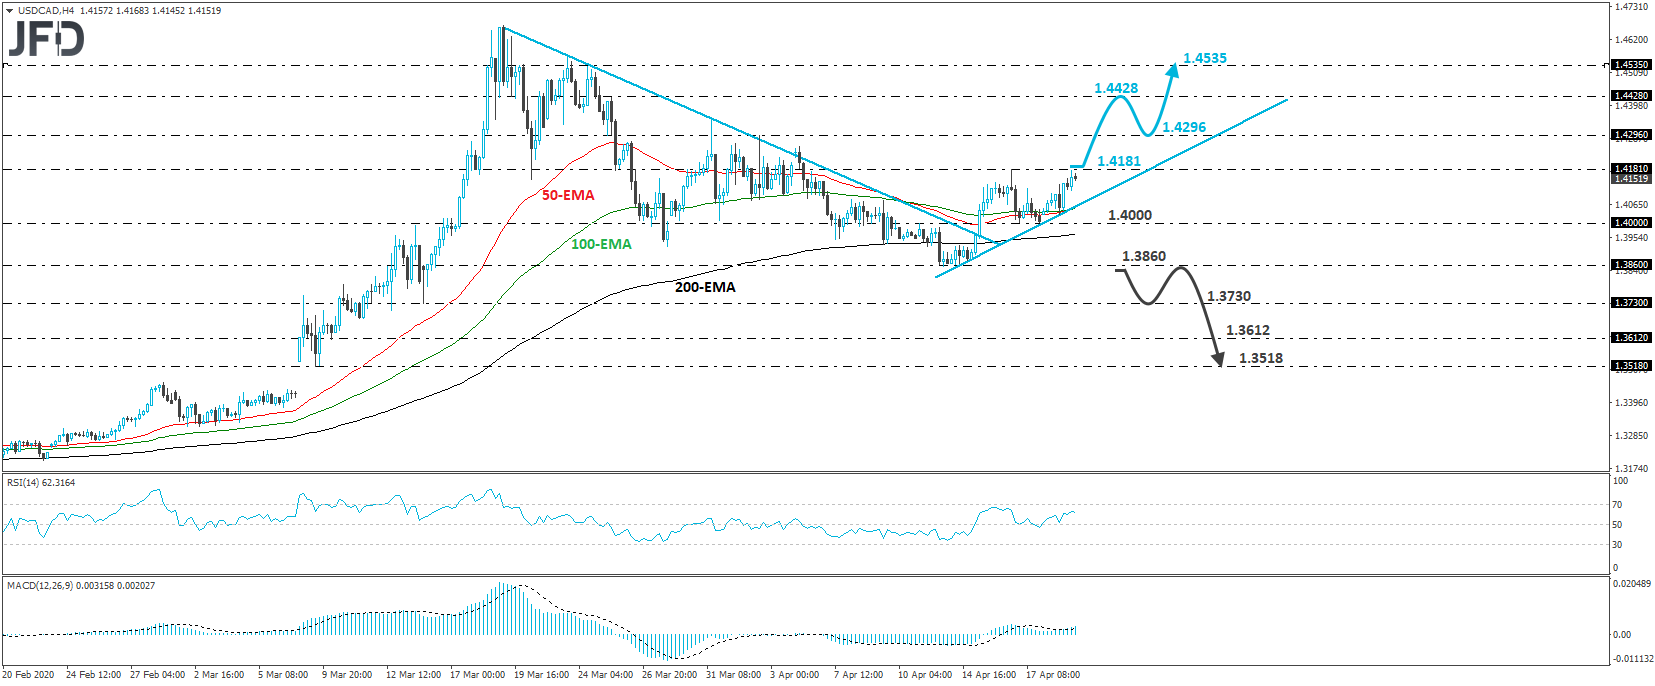
DJIA – TECHNICAL OUTLOOK
The Dow Jones Industrial Average cash index traded lower yesterday, after it hit resistance at the prior long-term upside support line drawn from the low of January 2016. Having that in mind, but also that the price structure remains higher highs and higher lows since March 23rd, we will take a flat stance for now.
In order to start examining whether more declines could be in the works, we would like to see a decisive dip below 22655, a support marked by the inside swing highs of March 26th and 27th. Such a move may set the stage for negative extensions towards, the low of April 2nd, at 20618, the break of which may allow the bears to put the low of March 23rd on their radars, at around 18215.
On the upside, we would start considering further recovery only if we see a rebound back above 24430. This would confirm a forthcoming higher high and would also drive the index back above the previously-mentioned upside line. The bulls may be encouraged to drive the battle towards the 25760 zone, where another break may see scope for bullish extensions, perhaps towards the peak of March 4th, at around 27125.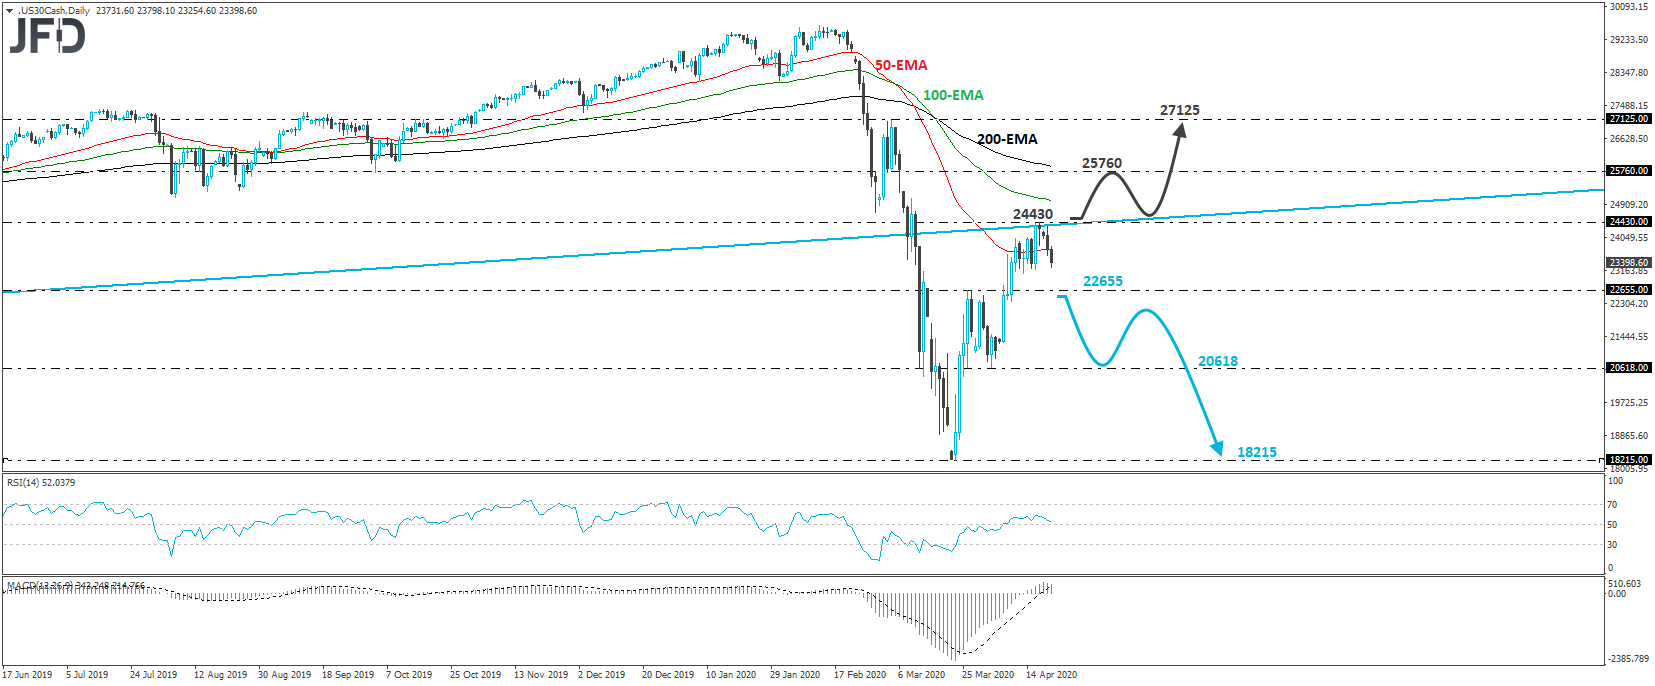
AS FOR TODAY’S EVENTS
During the European morning, we already got the UK employment report for February. The unemployment rate ticked up to 4.0% from 3.9%, while average weekly earnings including bonuses slowed to +2.8% yoy from +3.1%. The excluding-bonuses rate slid as well, to +2.9% yoy from +3.1%. That said, the pound did not react to the release, perhaps because it is referring to a period before the fast spreading of the virus started leaving deep wounds to the UK economy. We believe that GBP-traders may prefer to pay more attention to data referring to more recent periods, like the CPIs and retail sales for March, due out on Wednesday and Thursday respectively.
From Germany, we get the ZEW survey for April. Both the current conditions and economic sentiment indices are expected to have stayed in negative waters, but to have rebounded somewhat, to -30.0 and -43.0 from -43.1 and -49.5 respectively. Something like that may prove that the recent slowdown in the coronavirus spreading has somewhat improved analysts’ morale, and may raise speculation that the Ifo survey, which is based on manufacturers’ and retailers’ opinions, may follow suit.
Later in the day, we get Canada’s retail sales for February. The headline rate is expected to have ticked down to +0.3% mom from +0.4%, while the core one is anticipated to have rebounded to +0.2% from -0.1%. Similarly with the UK employment data, we don’t expect this release to prove a major market mover. We believe that Loonie traders may prefer to focus on more recent data, one of which may be Canada’s CPIs for March, due out on Wednesday.
In the US, we have the existing home sales for March, which are expected to have slowed to +0.7% mom from +6.5% in February. We also get the API (American Petroleum Institute) weekly report on crude oil inventories, but as it is always the case, no forecast is available. That said, another week of a strong jump in inventory builds may result in another round of selling in oil.
- English (UK)
- English (India)
- English (Canada)
- English (Australia)
- English (South Africa)
- English (Philippines)
- English (Nigeria)
- Deutsch
- Español (España)
- Español (México)
- Français
- Italiano
- Nederlands
- Português (Portugal)
- Polski
- Português (Brasil)
- Русский
- Türkçe
- العربية
- Ελληνικά
- Svenska
- Suomi
- עברית
- 日本語
- 한국어
- 简体中文
- 繁體中文
- Bahasa Indonesia
- Bahasa Melayu
- ไทย
- Tiếng Việt
- हिंदी
Equities Slide As U.S. Crude Oil Tumbles Sub Zero
Published 04/21/2020, 03:40 AM
Updated 07/09/2023, 06:31 AM
Equities Slide As U.S. Crude Oil Tumbles Sub Zero
Latest comments
Install Our App
Risk Disclosure: Trading in financial instruments and/or cryptocurrencies involves high risks including the risk of losing some, or all, of your investment amount, and may not be suitable for all investors. Prices of cryptocurrencies are extremely volatile and may be affected by external factors such as financial, regulatory or political events. Trading on margin increases the financial risks.
Before deciding to trade in financial instrument or cryptocurrencies you should be fully informed of the risks and costs associated with trading the financial markets, carefully consider your investment objectives, level of experience, and risk appetite, and seek professional advice where needed.
Fusion Media would like to remind you that the data contained in this website is not necessarily real-time nor accurate. The data and prices on the website are not necessarily provided by any market or exchange, but may be provided by market makers, and so prices may not be accurate and may differ from the actual price at any given market, meaning prices are indicative and not appropriate for trading purposes. Fusion Media and any provider of the data contained in this website will not accept liability for any loss or damage as a result of your trading, or your reliance on the information contained within this website.
It is prohibited to use, store, reproduce, display, modify, transmit or distribute the data contained in this website without the explicit prior written permission of Fusion Media and/or the data provider. All intellectual property rights are reserved by the providers and/or the exchange providing the data contained in this website.
Fusion Media may be compensated by the advertisers that appear on the website, based on your interaction with the advertisements or advertisers.
© 2007-2024 - Fusion Media Limited. All Rights Reserved.