
Equities pulled back yesterday as Russian forces bombarded the outskirts of Kyiv and a city in northern Ukraine, just after promising to scale down operations. Another reason for the selling may have been end-of-month portfolio rebalancing. Now, market participants may start turning their gaze to the Euro-area CPIs and the US jobs data, both due tomorrow.
Stocks Slide as Russia Continues to Bomb Ukraine
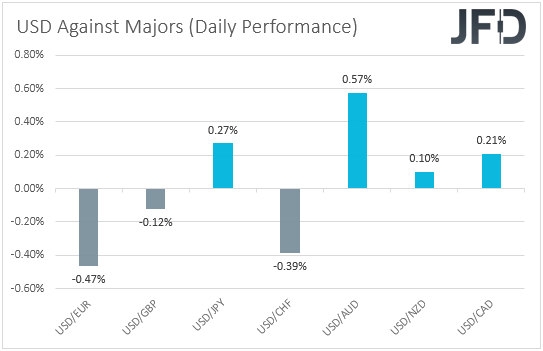
The US dollar traded mixed against the other major currencies on Wednesday and during the Asian session Thursday. It gained against AUD, JPY, CAD, and NZD in that order, while it lost ground versus EUR, CHF, and GBP.
The strengthening of the euro and the weakening of the Japanese yen suggest that markets may have continued trading in a risk-on manner yesterday and today in Asia. However, the strengthening of the Swiss franc and the weakening of the risk-linked Aussie point otherwise.
Therefore, with the FX market painting a blurry picture of the broader market sentiment, we prefer to turn our gaze to the equity world. We see that major EU and US indices traded in negative waters, with the reduced risk appetite rolling into the Asian session today. Among the indices under our radar, only UK’s FTSE 100 and South Korea’s KOSPI traded in the green.
Remember that equity markets climbed higher on Tuesday due to Russia and Ukraine announcing progress in peace talks held in Turkey. In what was described as the most tangible sign of progress until now, Russia promised to scale down military operations around Kyiv and northern Ukraine. At the same time, Ukraine expressed a willingness to adopt a neutral status.
That said, yesterday's headlines said that Russian forces bombarded the outskirts of Kyiv and a city in northern Ukraine. This may have come as a surprise, with market participants disappointed and soon scaling back their hope bets over a potential resolution.
Another reason for the setback in equities may have been that many fund managers may have been rebalancing their portfolios due to the end of the month. As for our view, we prefer to wait for the turn of the month to see how much of a disappointment Russia’s actions were and how much of just a rebalancing yesterday’s selling was.
For now, market participants may turn their attention away from the war and lock their gaze on tomorrow’s preliminary Euro-area inflation data and the US jobs report. Accelerating inflation in the Eurozone may add to speculation that the ECB may need to start raising rates sooner than previously anticipated.
Meanwhile, a strong employment report in the US, especially accompanied by accelerating wages, could add to a 50 bps hike at the Fed’s upcoming gathering and a steeper rate path.
DJIA – Technical Outlook
The Dow Jones Industrial Average cash index traded slightly lower yesterday but rebounded somewhat today in Asia, staying between the 35070 and 35445 barriers. However, the bigger picture still points to a short-term uptrend, and thus, we would still see decent chances for another rebound.
Even if the index pulls back once more, we could see the bulls recharging from near the 35070 barrier, and pushing for a test near the high of Feb. 11, at 35445. If they manage to overcome that hurdle, we may see the climbing towards the 35870 zone, marked by the highs of Feb. 9 and 10.
On the downside, we would like to see a clear break below 34920 before we start examining the case of a deeper correction. This could initially pave the way towards the low of Mar. 28, at 34540, the break of which could aim for the 34320 zone, marked by the lows of Mar. 23 and 24, or for the 34120 area, acted as a strong resistance between Feb. 22 and Mar. 3.

NZD/JPY – Technical Outlook
NZD/JPY also stayed range-bound yesterday, between the 84.42 and 85.55 levels. However, overall, it continues to trade above the upside support line drawn from the low of Feb. 24, and thus, we would consider the near-term outlook to be still positive, even I see some further retreat.
If a potential setback stays limited above the aforementioned upside line, we would expect the bulls to push for another test near the 85.55 barrier, which could pave the way towards the high of Mar. 28, at 86.95. Slightly higher lies the 87.76 barrier, marked by the inside swing low of May 12, 2015, where another break could see scope for extensions towards the 89.00 territory, marked by the high of Jun. 10, 2015.
We will start examining the case of a potential reversal upon a dip below 81.90, marked by the low of Mar. 21. This may confirm the break below the aforementioned upside line and encourage the bears to dive towards the 80.27 zone, marked by the inside swing high of Mar. 14.
If they are unwilling to stop there, we could see them pushing towards the 79.35 level, marked by the low of Mar. 15, or towards the 78.55 barrier, marked by the low of Mar. 8.
As for Today’s Events
During the Asian session, we already got the Chinese PMIs for March, with both the manufacturing and services indices sliding to the contractionary territory for the first time since the peak of the nation’s COVID outbreak in 2020. This may have been another reason investors abandoned stocks during the Asian trading today.
A few hours ago, the UK final GDP for Q4 was out, with the final print being revised up to +1.3% QoQ from +1.0%. Later, we get Germany’s and Eurozone’s unemployment rates for March and February respectively. The German one is expected to have held steady at 5.0%, while Eurozone’s is forecast to have ticked down to 6.7% from 6.8%.
From the US, we have the personal income and spending data for February, as well as the core PCE index for the month, the Fed’s favorite inflation metric. Personal income is expected to have risen 0.5% mom after stagnating in January, while spending is forecast to have slowed to +0.5% mom from +2.1%.
No forecast is available for the core PCE index, but bearing in mind that the core CPI rose to +6.4% YoY from +6.0%, we would consider the risks as tilted to the upside. However, at this point, we need to point out that, although it is the Fed’s preferred inflation gauge, the core PCE index is not a major market mover, and this is because we get the CPIs well in advance.