
Yesterday, the stock market recovered some of the losses made at the end of last week. Oil was also able to rebound as major oil producers agreed to tap into their reserves to ease the pressure on the global oil market. RBA kept its cash rate target at +0.1%.
Equities And Oil Bounce
Yesterday, the stock market recovered some of the losses made at the end of last week. The main driving sectors in the U.S. were consumer cyclicals, communication services, and technology. Twitter (NYSE:TWTR) was one of the top gainers in yesterday’s trading session, as it was reported that Elon Musk acquired around 9.2% of the company’s outstanding shares.
The shares of Twitter soared by around 27%. In addition to all that positivity, the US-listed Chinese companies moved strongly to the upside, as China’s securities watchdog suggested reviewing the confidentiality rules on the offshore listings.
Such a move may help clear the legal obstacle of overseeing audit cooperation. The biggest losing sectors in the U.S. yesterday were utilities, real estate, and healthcare. Let us not forget that, although we saw the market rebounding higher, negative pressures are still floating around due to the geopolitical tensions and high inflation.
Market participants are also aware of the upcoming rate hikes from the U.S. Federal Reserve. The main question now is not if the Fed will raise rates but at what pace and how significant each increase will be. According to the CME FedWatch tool, the current expectation is to see the rates in the target range between 2.50% and 2.75% by the end of this year.

Oil was also rebound yesterday as major oil producers agreed to tap into their reserves to ease the pressure on the global oil market. Given that new sanctions are about to be imposed against Russia, everyone is preparing for a complete boycott of Russian fossil fuels.
While Western Europe is seeking alternatives to Russian energy, Iran is slowly gaining popularity as a place to seek new energy contracts. However, given that the U.S. still has sanctions imposed on that middle eastern country, Western Europe is looking for ways to convince the U.S. to remove those restrictions temporarily.
The talks have stalled, as the U.S. is now seen as one of the leading potential suppliers of natural gas to Europe.
Brent Oil – Technical Outlook
The technical picture of Brent oil on our 4-hour chart shows that the price is currently stuck between two short-term tentative trendlines, where the upside one is drawn from the low of Feb. 18 and the downside one is taken from the high of Mar. 8. To consider the next short-term directional move, a breakthrough one of those lines would be needed.
If the commodity breaks the aforementioned downside line and rises above the 114.88 barrier, marked by the high of Mar. 30, that may attract more buyers into the game. Brent oil could rise to the 118.80 obstacle, marked by an intraday swing low of Mar. 25. If the buying doesn’t stop there, the next possible target might be at 120.69, or even at 122.92, marked by the high of Mar. 24.
On the downside, a break of the previously discussed upside line could open the door towards lower areas, as more sellers may join in. Brent oil might then drift to the 100.88 obstacle, a break of which could set the stage for a move to the 97.92 level, marked by the lowest point of March.

On the currency front, the euro was the main loser yesterday, falling sharply against its major counterparts, especially the U.S. dollar. This was caused by the talks about the potential new sanctions the West is planning to impose on Russia. Given that the commodity sector rose yesterday, commodity-linked currencies, such as AUD, NZD and CAD were the best performers.
Japanese Data And The RBA Rate Decision
Today's early hours of the Asian morning, Japan delivered its household spending figures on an MoM and YoY basis. Both numbers have declined strongly. The MoM reading fell from the previous -1.2% to -2.8% and the YoY reading went from +6.9% to 1.1%. This had put some pressure on Nikkei 225, forcing it to correct slightly lower. Nevertheless, the index closed the session in positive territory.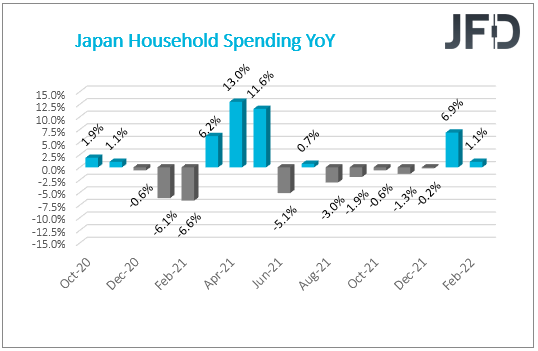
But, probably, the main event during the Asian morning was the RBA interest rate decision. The board decided to keep the cash rate target at +0.1% during the previous meeting. Although the bank sees that the global economy has been recovering well from the pandemic, the new concern has become the war in Ukraine and the uncertainty that surrounds it.
Although the RBA is concerned about the rising inflation in various parts of the world, the Australian economy remains resilient, as consumer spending has picked up in recent months. The board kept the rate at the same as previous during today’s meeting, at +0.1%.
The bank said that it would like to see real evidence that inflation is sustained within the 2-3% target range. The committee will continue assessing the information in the upcoming months when deciding on further changes in the monetary policy.
AUD/CAD – Technical Outlook
AUD/CAD popped higher this morning, creating a higher high, as it overcame the 0.9462 barrier, marked by the highest point of March. At the same time, the pair is still running above a short-term tentative upside support line taken from the low of Mar. 15. As long as the rate stays somewhere above that upside line, we will continue aiming higher.
A further push north may bring the pair closer to the 0.9556 hurdle, marked by the highest point of May 2021, where a temporary hold-up might occur. If the bulls remain in power, they could easily drag the rate towards the 0.9620 level, marked by the inside swing low of Apr. 22, 2021.
Alternatively, a break below the aforementioned upside line and a drop below the 0.9374 zone, marked by the low of Apr. 4, may signal a change in the direction of the current trend. AUD/CAD might then drift to the 0.9339 obstacle, or even to the 0.9290 level, marked by the low of Mar. 22.

During the European morning, the eurozone is set to deliver the final services PMI number for March. The forecast is for the number to remain the same, at 54.8. Anything above 50 shows that the service sector is still improving.
If the number comes out better than expected, this may slightly boost the euro against some of its major counterparts. The United Kingdom will also deliver its final services PMI number for March, which is also expected to stay the same, at 61.0.
The final services PMI data from the U.S. will be on the radar after that. The number is expected to improve from 56.5 to 58.9. However, the services PMI will not be the only piece of data that will come out from the U.S. The country’s ISM non-manufacturing PMI number will be on the lookout, as it is believed to have improved somewhat, going from 56.5 to 58.0.
As For The Rest Of Today’s Events
Canada will produce its trade balance figure for February. The current expectation is to rise from 2.62 bln to 2.90 bln.